I’ve added two more RS blogs to the Reporting Services link section. The Reporting Services Team blog is used by the RS team as a whole. The Reporting Services User Education blog is used by the education group on the Reporting Services team. It’s managed by a former colleague and friend of mine, Matt Mayer, who joined the Reporting Services team a year ago. The entire RS blog roll that I’ve compiled can be viewed by clicking any of the blog links on my website.
https://prologika.com/wp-content/uploads/2016/01/logo.png00Prologika - Teo Lachevhttps://prologika.com/wp-content/uploads/2016/01/logo.pngPrologika - Teo Lachev2007-04-27 18:53:002021-02-16 03:00:48Reporting Services Blog Roll
The March release of SQL Server 2005 samples is available for download. Note that Microsoft has moved all SQL Server 2005 samples (standard and open source) to the CodePlex website. The documentation is still on MSDN. So, GotDotNet is dead, long live CodePlex!
https://prologika.com/wp-content/uploads/2016/01/logo.png00Prologika - Teo Lachevhttps://prologika.com/wp-content/uploads/2016/01/logo.pngPrologika - Teo Lachev2007-04-27 18:37:202016-02-17 12:45:39SQL Server Samples to CodePlex
If you follow the Microsoft .NET roadmap, you have probably heard about the forthcoming Language Integrated Query (LINQ) in .NET 3.0. LINQ will add query capabilities directly into the CLR and will be supported by both VB.Net and C#. This means that you will be able to use standard query operators directly from within your code!
To help you get started with LINQ, Marco Russo and Paolo Pialorsi wrote a book Introducing Microsoft LINQ published by Microsoft Press. The book is expected to be published in mid-May. Meanwhile, the authors have set up a public forum (http://introducinglinq.com/) and they are eagerly awaiting your LINQ-related questions.
Oh, yes, I’ve made a tiny contribution to the book by reviewing a few chapters. I found the book to be a great introduction to LINQ. I particularly liked the code examples.
I had an interesting issue this week. I was working on a small test cube with financial data. The lowest grain in the measure group was the Account dimension which represents a customer bank account. I had to implement rolling 12 calculations on semi-additive measures (e.g. Avg Account Balance) by weighting the balances at the account level:
Rolling 12 Bal = ∑(Number of Account Active Days * Avg Account Balance) / ∑ (Number of Days for 12-month period
Since I had to weight the account balances by the number of the number of the days the account was active, I decided to scope at the account level, e.g.; SCOPE (Leaves(Account), Leaves(Date)…). Also, I had to use the ParallelPeriod() MDX function to sum the weighted balanced for the 12-month period.To my surprise, the small test cube took an enormous time to initialize in the Cube Browser. The Cube Profiler showed as many subcube events as the number of the accounts of the cube. It appeared that the server was initializing the expression for each account. This didn’t make sense at all considering the fact that the server should only write the formula in the scope cells which should happen pretty fast even with large cubes and very granular scope assignments. After some digging, it turned out that the culprit wasn’t the server but the Cube Browser L. For some obscure reason, the Cube Browser issues the following statement each time you reconnect even with an empty report.
select filter([Measures].members, [Measures].currentmember.member_caption = [Measures].currentmember.member_caption) on columns from [<cube name>]
This statement was causing the server to evaluate the Account All member which was triggering the formula evaluation for each account. Oops! The moral of this story is to test your cube initialization time in SQL Server Management Studio. As for me, I decided to reduce the scope (always a good idea) to Leaves (Date) only by pro-rating the Active Days in the data source so I could use the days in the month. This makes the formula universal on rows irrespective of the cube slice and makes the Cube Browser happy.
Thanks for Russell Christopher’s blog, I’ve learned that Microsoft donated an Analysis Services Load Simulator (ASLoadSim) sample project which lets you load test Analysis Services using the VS.NET 2005 test capabilities. While I am to try the code sample, I am very impressed by the whitepaper included in the sample which got harvested from Project REAL.
Chris Webb also contributed in the SSAS performance area by donating his MDX Script Performance Analyzer sample which I am yet to try as well.
Microsoft has released a cumulative update package (build 3161) for SQL Server 2005 SP2. Among other things, the update package fixes the SSRS black preview.
https://prologika.com/wp-content/uploads/2016/01/logo.png00Prologika - Teo Lachevhttps://prologika.com/wp-content/uploads/2016/01/logo.pngPrologika - Teo Lachev2007-04-22 01:09:472021-02-16 02:56:11Cumulative Update Package (build 3161) for SQL Server 2005 Service Pack 2 Available
Nick Barclay is telling us that the book The Rational Guide to Microsoft Office Business Scorecard Manager 2005 that he co-wrote with Adrian Downes is out! You can use BSM to design scorecards that can be published to SharePoint dashboards or SSRS reports. As far as I know, this is the first BSM book which makes it even more appealing.
https://prologika.com/wp-content/uploads/2016/01/logo.png00Prologika - Teo Lachevhttps://prologika.com/wp-content/uploads/2016/01/logo.pngPrologika - Teo Lachev2007-04-17 13:08:352021-02-16 02:56:10The Rational Guide to Microsoft Office Business Scorecard Manager 2005
A bit outdated announcement perhaps but the Office team has released a Designing SQL Server 2005 Analysis Services Cubes for Excel 2007 PivotTables whitepaper. Instead of pestering you with how-to PivotTable questions, now your users can have proper documentation. A great deal of it discusses UDM implementation details but who is to say that you didn’t travel the extra mile… As for me, well I still wait for the Office team to implement a few more goodies like pre-filtering support for large dimension, before I get impressed by Excel 2007 as an SSAS browser.
https://prologika.com/wp-content/uploads/2016/01/logo.png00Prologika - Teo Lachevhttps://prologika.com/wp-content/uploads/2016/01/logo.pngPrologika - Teo Lachev2007-04-17 12:59:192016-02-17 11:13:36Designing SQL Server 2005 Analysis Services Cubes for Excel 2007 PivotTables Whitepaper
I’ve been having fun lately with a dashboard page which has an Excel Web Access (EWA) web part connected to a PivotTable report. The PivotTable report is nothing to brag about. It displays a few KPI-related measures coming from an SSAS cube. PivotTable was converted to formulas to achieve a free-form report layout. So far, pretty straightforward stuff. That is, until the customer wanted the ability to drill through the chart to see a more detailed view from the cube.
Since to my understanding cross-EWA drillthrough is not possible because Excel Services is not URL-addressable (shame [:@]), I implemented this scenario by allowing the user to drill through from the Excel spreadsheet to an SSRS report. To implement this, I converted the Excel cell to a hyperlink which has the URL address of the SharePoint report using the Excel HYPERLINK function:
There are a few interesting things going on in this nasty expression that deserve more explanation. First, instead of hardcoding the server name, I added a ServerName calculated member to the cube that is mapped to the following SSAS stored procedure:
publicstaticstring ServerName() {
returnContext.CurrentServerID;
}
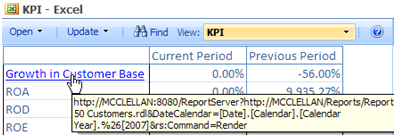
Second, note the URL address of the report. Since SSRS is configured for SharePoint integration, the report path points to the WSS library where the report is deployed. Finally, I had to solve the nasty issue with ampersands in the member names b/c the drillthrough SSRS report takes a member as a parameter. If I just use & the Report Server will choke b/c it will think that it is a parameter placeholder. The hack is to escape & to %26 .
Here is what the link looks when rendered in the browser.
https://prologika.com/wp-content/uploads/2016/01/logo.png00Prologika - Teo Lachevhttps://prologika.com/wp-content/uploads/2016/01/logo.pngPrologika - Teo Lachev2007-04-02 19:24:002016-02-17 11:18:41Excel Web Access Drill-through to SSRS Report