Yesterday, Microsoft released SQL Server 2005 Service Pack 3. Reporting Services Report Builder added support with Teradata. Note that some manual configuration is required to turn things ‘on’ as well as you need to install the .Net provider from Teradata.
https://prologika.com/wp-content/uploads/2016/01/logo.png00Prologika - Teo Lachevhttps://prologika.com/wp-content/uploads/2016/01/logo.pngPrologika - Teo Lachev2008-12-18 13:03:022016-02-17 10:38:11SQL Server 2005 Service Pack 3 is Out
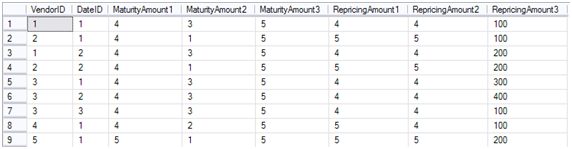
Let’s say you need a way to unpivot the results in the following format which is more suitable for OLAP:
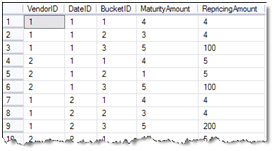
In this way, you eliminate the repeating measure columns with a single column. Here, the BucketID column is introduced so you could join the results to a dimension to let the user cross-tab the results on columns.
Solution
Usually, ETL processes would take care of transforming data in format suitable for analysis especially with large data volumes. However, with smaller fact tables and an OLAP layer directly on top of the operational database, such as having SQL views directly on top of the source database, you may need an ad-hoc approach to unpivot the results. Assuming you are fortunate to have SQL Server 2005 or above, you can use the SQL Server UNPIVOT function to unpivot on multiple columns. The following query does the trick:
SELECT VendorID, DateID, CAST(REPLACE(Maturity, ‘MaturityAmount’, ”) as int) as BucketID,
RepricingAmount1, RepricingAmount2, RepricingAmount3 FROM pvt) p
UNPIVOT
(MaturityAmount FOR Maturity IN (MaturityAmount1, MaturityAmount2, MaturityAmount3)) AS UnPivotedMaturity
UNPIVOT
(RepricingAmount FOR Repricing IN (RepricingAmount1, RepricingAmount2, RepricingAmount3)) AS UnPivotedRepricing
WHERE REPLACE(Maturity, ‘Maturity’, ”) = REPLACE(Repricing, ‘Repricing’, ”)
Notice that a WHERE clause is needed to join the two unpivoted sets so you don’t end up with a Cartesian set. The net result is that the number of rows in the unpivoted dataset is:
Number of Rows in Pivoted (original) Table * Number of Repeated Columns
So, in our case, the dataset will have 9 * 3 = 27 rows.
A common issue when setting up Reporting Services integration with SharePoint is that the SharePoint add-in is not installed properly although the setup program doesn’t indicate any issues. More than likely, the culprit is that the person who installed the add-in is not SharePoint Web farm administrator and Site Collection administrator.
As a first stop for troubleshooting SharePoint integration issues, you should examine the add-in log after the add-in setup completes to verify if it was installed successfully. You’ll find the log file (RS_SP_<N>.log) in your temp folder, such as \Documents and Settings\<login>\Local Settings\Temp. Specifically, check that all activation tasks have completed successfully and that there are no errors. If all is well, the log files should look as follows:
Microsoft has released the Cumulative Update 2 build (build number 1779) for SQL Server 2008. The update is not publicly available as of now. It has to be released individually based on whether you are running into a bug fixed in the build and it is password-protected. Among other things, it fixes the freeze issue associated with opening SSAS projects in BIDS.
https://prologika.com/wp-content/uploads/2016/01/logo.png00Prologika - Teo Lachevhttps://prologika.com/wp-content/uploads/2016/01/logo.pngPrologika - Teo Lachev2008-11-19 17:58:452016-02-17 10:42:49Cumulative Update 2 for SQL Server 2008
Issue: You author an SSRS report that connects to a cube. You want to create a calculated member that uses a report parameter. For example, the Selector calculated member in the following query returns 1 if a given employee has exceeded 1 million in sales for the dates specified by the user in the report parameter.
select non empty {[Measures].[Reseller Sales Amount],[Measures].[Reseller Order Quantity], selector} on 0,
non empty (Filter([Employee].[Employee].[Employee].Members, [Measures].[Selector]>0) * [Date].[Calendar].[Calendar Year]) on 1
from (select StrToSet(@DateCalendar) on 0 from [Adventure Works])
However, when you run the query you get the following error if you target Analysis Services 2005:
The DateCalendar parameter cannot be resolved because it was referenced in an inner subexpression.
Obviously, the built-in SSAS data provider has an issue parsing parameters in a calculated member. This issue is apparently fixed in SQL Server 2008 where the above query executes just fine.
Workaround: As a workaround with SQL Server 2005, try defining a set that references the parameter and use the set in the calculated members, as follows:
select non empty {[Measures].[Reseller Sales Amount],[Measures].[Reseller Order Quantity], selector} on 0,
non empty (Filter([Employee].[Employee].[Employee].Members, [Measures].[Selector]>0) * [Date].[Calendar].[Calendar Year]) on 1
from (select StrToSet(@DateCalendar) on 0 from [Adventure Works])
https://prologika.com/wp-content/uploads/2016/01/logo.png00Prologika - Teo Lachevhttps://prologika.com/wp-content/uploads/2016/01/logo.pngPrologika - Teo Lachev2008-11-10 00:09:002016-02-17 10:44:36Referencing Parameters in SSRS Calculated Members
On Friday, Microsoft released chart controls for Microsoft .NET Framework 3.5. These are re-tooled Dundas .NET chart controls which are now baked in the .NET framework. This is important because you can add the same stunning Dundas chart features to your Windows Forms and ASP.NET applications without external dependencies or licensing fees. It also minimizes your learning curve, as the Dundas controls share the same object model across technologies, e.g. Windows Forms to ASP.NET to Reporting Services.
Currently, only the Dundas chart control has made the cut to .NET. There is a sticky post at the top of the forums that has all of the links. Keep an eye on the PDC announcements today for more BI goodies.
https://prologika.com/wp-content/uploads/2016/01/logo.png00Prologika - Teo Lachevhttps://prologika.com/wp-content/uploads/2016/01/logo.pngPrologika - Teo Lachev2008-10-27 16:09:542016-02-17 10:45:14Dundas Chart Controls for .NET Available
I’ve been involved recently in a quest to optimize an SSAS 2008 long-running query that would return the 12-month history of a KPI. Since the KPI was displayed on a dashboard page alongside other KPIs and charts, it was important to optimize the query as much possible. Rephrased to Adventure Works, the query went something like this:
This query compares the sales for each customer with the customer’s sales for the previous month and returns the number of customers who have increased sales for the past 12 months. Also, the query uses a subselect to exclude a customer and a WHERE clause that restricts the results to USA and United Kingdom only. The real-world query would get the members to filter in the WHERE clause from the UI.
The first optimization technique to point out is that instead of filtering the customer set using the Filter function, the query benefits from Mosha’s summator trick, which alone improved the query performance about ten times. However, the query was still taking long to execute (some 30 seconds with set of 150,000 customers). Much to my surprise though, flipping the WHERE and the subselect clauses cut the query time in half.
Here, the member that needs to be excluded was moved to the query WHERE clause, while the rest of the filter went to the subselect. While I don’t know what the server does exactly, my hypothesis is that the WHERE clause is more efficient in restricting the cube space before the rest of the query is executed. I wasn’t able to reproduce the performance gain with the Adventure Works cube probably because is too small or the issue was design specific. Larger cubes may benefit from the filter flip.
IMPORTANT OOPS [:(]
As Mosha was quick to point out, in particular case where SUM is used, the attempt to exclude a given customer in both cases (subselect and WHERE) will not work. Specifically, filtering out the customer is a no-op, since the Customer.Customer.Customer inside Sum overwrites it. Consequently, the queries don’t exclude this customer from the computations at all and therefore are wrong. A great optimization without QA involvement, indeed :-). However, I still can’t explain why subselect is slower if both options are no-ops. BTW, if the exclude filter was done on another attribute (not Customer), then the subselect would produce the correct results, while the WHERE clause will still be a no-op.
In this particular case, the easiest way to exclude specific customers is to remove them from the set inside the SUM function, as the following query shows. This, of course, will impact the query performance. Based on my test, the member exclusion adds about 25% overhead to the query.
Today, Microsoft released Report Builder 2.0 (build 10.00.1600.60) , as Robert Bruckner announced in his blog. This is a major milestone in the Reporting Services roadmap. In my opinion, Report Builder 2.0 is one of the most important and exciting features of Reporting Services 2008 as it bridges the gap between standard and end-user (ad hoc) reporting. You should definitely consider Report Builder and Analysis Services for your ad-hoc reporting projects.
At the BI Conference in Seattle, Microsoft announced the future roadmap for next BI-oriented SQL Server release, nee Kilimanjaro, that will focus on three major teams:
• Self Service Analytics
• Self Service Reporting
• Sharing, Collaboration & Management
The Self Service Analytics will encompass projects Madison (a share-nothing MPP scale-out version of SQL Server, powered by DATAllegro technology) and Gemini, which I mentioned before.
The Self Service Reporting is where Reporting Services.NEXT will come in, of course. Microsoft announced the acquisition of 90 Degree Software. In case you are not familiar with this company, 90 Degree Software has built a very comprehensive report designer that is very similar to Report Builder 2.0. What I expect from this acquisition is more end-user enhancement in Report Builder 2.0 and improved Analysis Services integration. Expect also a shared report library that lets the end user save and share report elements and templates with other users.
The SoftArtisans acquisition will finally materialize in Kilimindjaro to empower business users to author reports inside Microsoft Office. Expect the preview bits of Kilimanjaro in 1H2009 with release in 1H2010. Watch the keynote presentation online.
As the news arrived today (see Mosha Pasumansky blog, Chris Webb blog, and Marco Russo blog) , the BI Conference revealed what has been brewing for a while in the Microsoft BI nest. Project Gemini, which one may call Memory-based Dimensional Model (MDM) to draw a comparison with the Unified Dimension Model (UDM), will let business users create ad-hoc cubes that are stored in memory. This will let Microsoft compete with other BI players, such as the Cognos TM1 offering which Cognos acquired from Applix. Accidentally, I dare to predict that MDM will be very similar to TM 1 (watch a demo here) but of course better J.
While I need to get my hands on this Gemini thing to say something worthwhile, I really hope that existing UDM cubes could benefit from it as well, especially in terms of performance. Today, folks are pushing SSAS to its limits. A dashboard page, for example, may need to execute many queries and crunch huge volumes of data to present trend graphs within seconds. It will be cool if Gemini lets you cache subcubes in memory to speed up these scenarios. For example, if you need to implement a bunch of customer-related KPIs, it will be nice if you could tell Gemini to cache in memory or materialize to disk the pre-aggregated at the customer level data and which dimensions can be used to slice these KPIs.
What about giving the business users the option to create ad-hoc cubes? I have to admit I have mixed fillings about this. The term “OLAP” alone is known to cause severe brain crunch to many users. I am a bit skeptical that “off you go, start building your own cubes in Excel” philosophy will really fly. If you package a cool wizard that hides some of the dimensional model complexity, how would verify that the results are indeed correct so you don’t end up with as many versions of the truth as the number of users? How would teach end users MDX to create their own calculations? Not sure how much of your time Gemini will really save if this is its major selling point. But again I may change my point of view as details unfold as life often proves me wrong. Meanwhile, long live MDM and Kilimanjaro, which is the code name for SQL Server.NEXT, scheduled for H1 2010!
https://prologika.com/wp-content/uploads/2016/01/logo.png00Prologika - Teo Lachevhttps://prologika.com/wp-content/uploads/2016/01/logo.pngPrologika - Teo Lachev2008-10-07 01:27:002021-02-16 03:44:49Memory-based Dimensional Model (MDM) on the Horizon