The Aggregate Function

Reporting Services supports an Aggregate function to retrieve aggregated values directly from the data provider if the provider supports this feature. The Aggregate function is especially useful with retrieving data from Analysis Services because it may be difficult if not impossible to recreate aggregated values on the report, such as when the cube script overwrites the server aggregates.

It’s easy to use the Aggregate function. Just replace the default Sum() aggregate function with Aggregate() in the group subtotals. When you do this, the Analysis Services provider brings in additional rows that include the server aggregates which the report displays in the group subtotals.

Recently, I came across a report that would return the following exception after attempting to use Aggregate().

The Value expression for the text box ”<textbox.’ uses Aggregate with an invalid scope parameter.

I couldn’t find anything wrong with the way Aggregate() is used because it was in the right place on a crosstab report. Robert Bruckner from the Reporting Services team helped me understand the Aggregate() function limitations:

The Aggregate function can only be used if the current scope and all parent group scopes are all based on simple field references (e.g. =Fields!Accounts.Value), or constants. The Aggregate function also cannot be used in detail rows.

In my case, the report was using a parent-child Analysis Services hierarchy. To show the data recursively, the tablix Details group was set to group on =Fields!Account.UniqueName. This is an extended property that the SSAS provider supports and it’s not a simple reference. Changing the grouping to =Fields!Account.Value resolved the issue.

Why We Can’t Connect Anymore?

New OS (Windows 7 in this case) and new issues when trying to connect to Analysis Services on a remote server.

I installed Windows 7 and added it to a corporate domain. I can use SSMS to connect to some SSAS servers but there was one server (the most important of course) which refused the connections with the following dreadful message which I am sure you’ve seen somewhere along the line:


TITLE: Connect to Server

——————————

Cannot connect to <servername>.

——————————

ADDITIONAL INFORMATION:

The connection either timed out or was lost. (Microsoft.AnalysisServices.AdomdClient)

——————————

Unable to read data from the transport connection: An existing connection was forcibly closed by the remote host. (System)

——————————

An existing connection was forcibly closed by the remote host (System)


I was able to connect to that server from other non-Windows 7 machines so I narrowed the issue to Windows 7. Interestingly, running the SQL Server Profiler on the server showed that the right Windows identity was passed so the issue wasn’t with the server itself either. Even more interesting, I had no problems connecting to SQL Server Database Engine on that server using Windows Authentication. Attempting to connect to the server using the SQL Server Profiler on the Windows 7 machine or attempting to browse the cube in BIDS would shown another enlightening message:

“The security database on the server does not have a computer account for this workstation trust relationship”

Binging the internet showed that Kerberos doesn’t agree with Windows Server 2008 on the server and Windows Vista (or Windows 7) on the client. But, in my case, the server was running Windows Server 2003 with SP2. More binging and an Eureka moment after reading KB 976419 which luckily has just been released.

Windows Live ID Sign-in Assistant 6.5 installs a new Security Support Provider (SSP) package. The SSP package causes the Security Support Provider Interface (SSPI) that is used by the Analysis Services OLE DB provider not to switch to NTLM authentication.

You gotta be kidding me! So, the unassuming Live ID Assistant, which every Live application out there recommends, nukes NTLM connectivity to Analysis Services? In case you are interested, since a hotfix wasn’t available yet, I went with method 2, which unregisters the livessp provider, and the problem when away.

I got to say that for the past two years I had my fare share of connectivity issues with Analysis Services. It looks to me that the Analysis Services team has to go back to the OLE DB Provider drawing board and solve these issues. If I can connect to the Database Engine, I should be able to connect to Analysis Services.

Applied Analysis Services 2008 Online Training Class with Teo Lachev

We are excited to announce the availability of an online Analysis Services 2008 class – no travel, no hotel expenses, just 100% content delivered right to your desktop!  This intensive 3-day online class (14 training hours) is designed to help you become proficient with Analysis Services 2008 and acquire the necessary skills to implement OLAP and data mining solutions. Learn how to build an Adventure Works cube from scratch. Use the opportunity to ask questions and study best practices..

102409_2255_AppliedAnal1

Applied Analysis Services 2008 Online Training Class
with Teo Lachev

Date: November 16 – November 18, 2009
Time: Noon – 4:30 pm EDT; 9 am – 1:30 pm PDT
14 training hours total for only $799!

102409_2255_AppliedAnal2

 Attend this class for only $799 and get a free unrestricted e-book copy of the book Applied Analysis Services 2005 by Teo Lachev!

For more information or to register click here!

Phantom URLs

An interesting “issue” popped up today. I did a fresh install of Windows 7 on my brand new HP 8530w laptop, which is a great laptop BTW. I install SQL Server 2008 followed by SP1 only to find that the Web Service URL and Report Manager URL don’t show up in the Reporting Services Configuration Manager.

1122.ora1.png-550x0

The report sever would run just fine on http://localhost/reportserver and the URLs were registered correctly in the rsreportserver.config. I went as far as whipping out some WMI code and it would return the URLs as it should. But the darn URLs won’t show up. Not to mention that another user has recently reported the exact same issue to me. A bug? I started thinking of re-installing SQL Server.

Then, a Eureka moment! As with most things, there was an easy explanation. For some reason, Windows 7 has set the system font size to be 125%. Resetting it to 100% fixed the issue although it could have been a good idea to increase the label height in Reporting Services Configuration Manager to avoid such font scaling issues.

Intelligencia for Silverlight

After retiring Office Web Components (OWC), which can hardly can pass the web test as it is implemented as an ActiveX control, Microsoft left developers with no web-based browser for Analysis Services. True, for those who can afford the hefty price tag, Microsoft Office SharePoint Server (MOSS) supports server-side Excel spreadsheets that render to HTML. However, while Excel rules the Windows-based OLAP browser space, HTML-based Excel spreadsheets with limited filtering can hardly meet the demand for web-based interactive reporting. Then, there is an option to author Reporting Services OLAP reports but outside limited interactive features their layout is pretty much fixed at design time.

What’s really needed is a Silverlight Analysis Services control that ships with Visual to let developers embed an Excel-like Analysis Services browser into their ASP.NET applications. You need this control and I need it but it’s not coming anytime soon. Meanwhile, third-party vendors rush in to fill the gap.

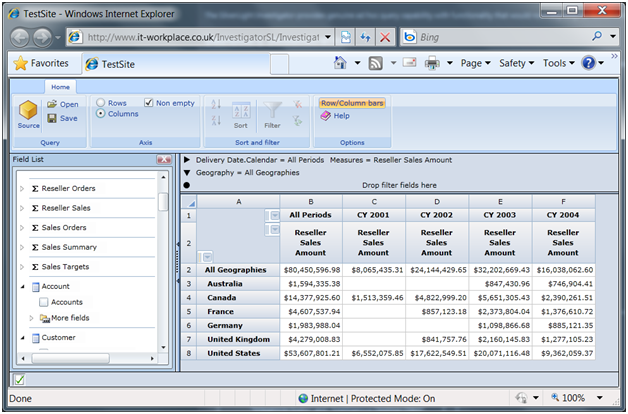
In a recent project, we used Dundas OLAP Chart for Analysis Services, which I mentioned in one of my previous blogs. Dundas has just released version 7 of this control and I really like what I see. It’s currently the best OLAP-based chart in the industry. The Dundas OLAP Chart for Analysis Services is a regular ASP.NET control with AJAX features for improved user experience. With Silverlight establishing as the web platform of choice for web developers, you may be looking for a Silverlight-based Analysis Services browser. This is where the Intelligencia for Silverlight comes in.

101909_0122_Intelligenc1

I blogged about Intelligencia for Reporting Services before and pointed out where I think it surpasses the MDX Query Designer included in Reporting Services. What IT-Workplace has done this time is bringing their product to the web and it has wisely decided to use Silverlight. The moment I saw the new version, it grabbed my attention. Users familiar with Excel PivotTable reports would find the Intelligenca metadata pane (Field List) very similar. Users can create a report by dragging and dropping objects to the report pane on the right. Actually, I would love to see IT-Workplace adding the Filter, Columns, Rows and Filter panes below it just like Excel. I’d welcome also in-place filtering just like Excel. You got the idea. For me and my users, the more Excel-like the browser is the better. This lowers the learning curve and unifies the desktop vs. web experience.

But Intelligencia for Silverlight is more ambitious than just bringing Excel-like reporting to the web. The control has scriptable interface and a filter control which allows management dashboards to be created by linking grids and filters, as the first link101909_0122_Intelligenc2 on the web page demonstrates.


In summary, while still rough around the edges (it’s currently in a beta phase), I think Intelligencia for Silverlight has a lot of potential and is positioned to fill in a wide gap left by Microsoft by letting web developers embed an Analysis Services OLAP browser in their applications. Powered by Silverlight, Intelligencia for Silverlight could bring Excel PivotTables to the web. Visit the Intelligencia for Silverlight web page, download and test the control, and provide feedback to improve the control