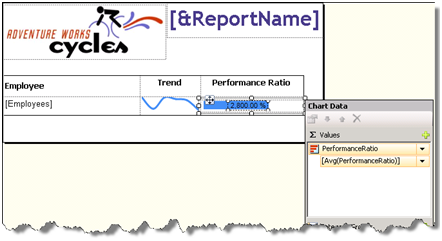
SharePoint List Data Extension
R2 brings several SharePoint enhancements, including:
- Support for multiple SharePoint zones – Previously, SSRS supported access from SharePoint URLs in the default zone, as I explained before.
- Support for the SharePoint Universal Logging service – Reporting Services introduced a new server interface called IRSSetUserToken. When this interface is implemented, the report server calls the UserToken Set property on this interface and passes the SharePoint user token to the data extension.
- Scripting with the rs utility – The rs utility now supports servers configured in SharePoint integrated mode. This lets you create scripts that automate management tasks that target report servers in SharePoint mode.
- New SharePoint List Data Extension – Lets you report from SharePoint lists
The last on the list, the new SharePoint List data extension, probably picked up your interest and deserves more explanation. Previously, if you had to use the XML Data Provider to call the SharePoint web service if you wanted to report off SharePoint lists. The new extension simplifies this by supporting SharePoint lists natively. But before you get too excited about it, I have to dampen your enthusiasm by mentioning two limitations:
- The extension supports querying a single list only.
- It doesn’t support folders if the list organizes items in folders.
The SharePoint List data extension is supported with both modes – native and SharePoint integrated. It supports Windows SharePoint Services 3.0 and 2010, as well as MOSS. Next, I’ll demonstrate the SharePoint List extension by setting up a dataset that retrieves items from the Issues list of a SharePoint site. The SharePoint list extension is available both in the BIDS Report Designer and Report Builder 3.0. For the purposes of this demo, I’ll use the BIDS Report Designer.
Configuring the data source
Start by setting up the data source as you would normally do when you author a report.
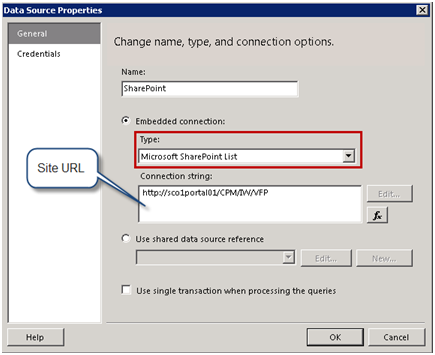
- Set up a data source that uses the Microsoft SharePoint List provider.
- In the Connection String field, enter the URL of the SharePoint site that has the list you want to query.
- Switch to the Credentials tab and select the Use Windows Authentication option. Click OK to close the Data Source Properties dialog.
Configuring the dataset
Once the data source is in place, the next steps will be to set up a dataset. The SharePoint List data extension supports a graphical query designer that lets you select and filter a list.
- Add a new dataset that uses the data source you’ve just created. On the Dataset Properties, click the Query Designer button.
Report Designer loads the graphical query designer. The SharePoint Lists pane shows all lists in the library. You can check a list to get all fields of the list or select individual fields. You can hover on a field to see additional properties as tooltips, such as Name, Identifier, Field Type and Hidden properties.
You can also filter the list. In this case, the Issues list is associated with a My Issues view. Since I don’t have any issues assigned to me, I had to overwrite the list filter by supplying a non-empty query filter. For demo purposes, I decided to set up a filter where the Title column contains the word “parameter” and the Modified date is after 10/1/2009.
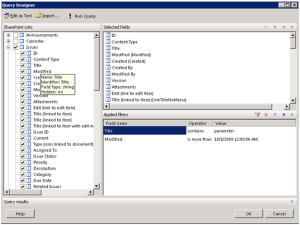
- Click the Run Query button to execute the query and see the data and the OK button to close the Query Designer and generate the dataset.
In case you are curious what the actual query looks like, click the Edit As Text query button. If you want to get all fields, the query can omit the ViewFields element.
<RSSharePointList xmlns:xsi=”http://www.w3.org/2001/XMLSchema-instance” xmlns:xsd=”http://www.w3.org/2001/XMLSchema”>
<ListName>Issues</ListName>
<ViewFields>
<FieldRef Name=”ID” />
<FieldRef Name=”ContentType” />
. . .
</ViewFields>
<Query>
<Where>
<And>
<Contains>
<FieldRef Name=”Title” />
<Value Type=”Text”>parameter</Value>
</Contains>
<Gt>
<FieldRef Name=”Modified” />
<Value Type=”DateTime”>2009-10-01T00:00:00</Value>
</Gt>
</And>
</Where>
</Query>
</RSSharePointList>
The SharePoint List data extension is a new R2 feature that simplifies the process of authoring reports from SharePoint lists. Although it doesn’t support all features of third-party data extensions for SharePoint, it’s a welcome enhancement that lets you retrieve and filter items from a single SharePoint list.