You can use the Microsoft Connect website to find most requested features. Unfortunately, the search doesn’t let you specify a product so the search results may be related to other products. For example, searching on reporting services may bring in results from Analysis Services and reporting. Nevertheless, it was quite interesting to find the top voted suggestions. For example, the following query shows the top suggestions for Reporting Services (flip to the Suggestions tab):
Scenario: You have an Internet-facing web application that uses the Visual Studio ReportViewer control to render reports. The application takes care of authenticating the users. You want all report requests to the report server to go under a single (trusted) Windows account. There are at least two approaches to implement this scenario:
Basic Authentication
You can configure ReportViewer for basic authentication by implementing the Microsoft.Reporting.WebForms.IReportServerCredentials interface, as follows:
Specifically, you need to implement the NetworkCredentials property of IReportServerCredentials. In my case, I read the trusted account credentials from web.config. Once IReportServerCredentials is implemented, you need to configure ReportViewer to use it. This takes one line of code:
The advantage of using IReportServerCredentals if flexibility. You can retrieve the account credentials from any place, such as security service, configuration file, database, etc. In addition, the impersonation is scoped for ReportViewer only. Other network calls made by the applications are unaffected.
Process Identity
The issue with IReportServerCredentals is the application must deal with the credentials of the trusted account, including the password. For added level of security, I try my best to avoid handling passwords and use Windows authentication whenever I can. Therefore, my preferred approach is to change the process identify of the web application. One way to do this is to change the identity of the IIS application pool the web application is running under, as follows:
If you don’t have a domain account to use as a trusted account, create a new domain account.
On the web server, add the account to the IIS_WPG local Windows group to give it the necessary rights to be used as an application pool account.
In the IIS Manager, expand the server name, right-click the Application Pools folder, and click New Application Pool.
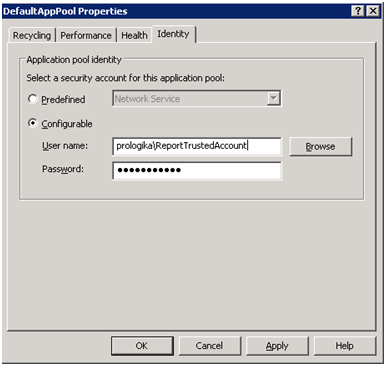
Give the new pool a name. In the pool Properties page, click the Identity tab, select the Configurable option, and enter the credentials of the trusted account.
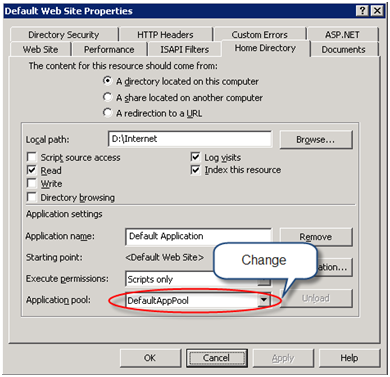
Open the web application properties and change its application pool to the pool you just created.
If present, remove <identity impersonate=”true”/> element from the application web.config file so the network calls are made under the process identify instead of the anonymous user account, such as IUSR_<MACHINE_NAME>.
At this point, if you run the web application, you may get a permission error because the domain account doesn’t have the necessary rights to specific folders, such as the web application folder and the temp folder. Using Windows Explorer, grant the domain account (or IIS_WPG group) rights to these folders. The error message should include the path of the folder you need to grant access to.
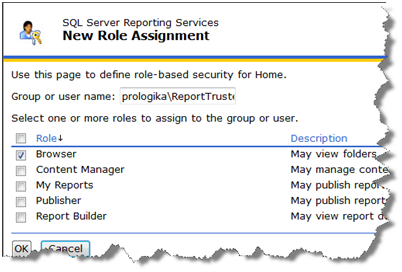
Finally, use the Report Manager to grant the necessary rights to the trusted account, such as Browser, to the required folders.
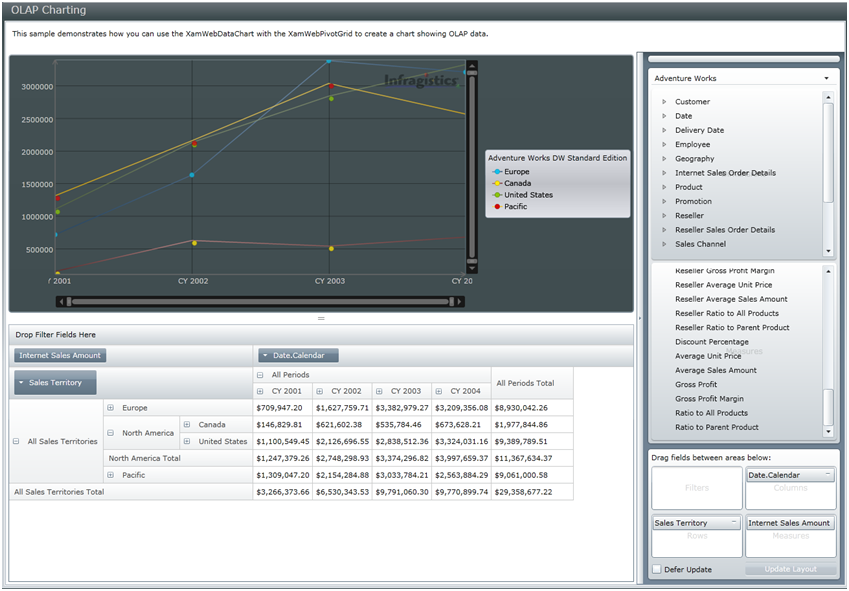
Don Demsak pointed out another Silverlight-based control from Infragistics, which is currently in a CTP phase. There are actually two controls: XamWebDataChart and XamWebPivotGrid. I played a bit with it and it looks great. I liked the Excel-like paradigm with the metadata pane on the right and the PivotChart and PivotTable synchronized. As I’ve been saying – give me a Silverlight-based Excel Pivot and I am happy.
See my previous blog about the Intelligencia for Silverlight which is another Siliverlight-based control for Analysis Services.
Analysis Services leads the OLAP server market and it should be your platform of choice for historical and trend reporting. In the spirit of the season, here is my Top 10 Wish List for Analysis Services. All items are related to regular cubes and none to PowerPivot which I am yet to try.
Improved client support – No 1 on my list has nothing to do with the server itself but with how well the Microsoft-provided clients support Analysis Services. To its credit, Microsoft continues improving the Excel OLAP support but still there are major functionality gaps from one tool to another. This is especially evident in the area of Reporting Services (see my No 1 SSRS wish list item). I am not sure if that’s possible from a technical standpoint but I wish the SSAS team re-factors the query generation logic into a MDX Query Generator binary of some kind which all tools can share to produce the same results consistently.
Focus on UDM (aka Corporate BI) – Although I see some useful scenarios for self-serviced OLAP with PowerPivot (previously known as Gemini), for various reasons I believe the focus should stay on UDM which now Microsoft refers to as Corporate BI. First, the business problems that I solve with UDM exceed by far Gemini’s capabilities. Second, if not a single source for reporting and a single version of the truth, I believe UDM should handle 80-90% of the reporting needs. Finally, based on my experience, data acquisition is the most difficult thing. This is why we have a dimensional model which IT would put together. But once data is cleaned and transformed, building UDM on top of it shouldn’t take that long
Silverlight OLAP Viewer control – A Silverlight-based control that ships with Visual Studio to let developers embed an Excel-like Analysis Services browser into their ASP.NET applications.
Improved performance – Version 2008 has brought significant performance enhancement and SSAS performs great when aggregating regular measures. Usually, it is the calculations that will get you in trouble. So, anything that can be done to improve the server performance further will be welcome. For instance, the calculation engine executes the query on a single thread. It will be nice if a more complicated query can be parsed and executed in parallel.
MDX Query Analyzer – Related to performance, it will be great if we finally get a graphical query analyzer (a-la the T-SQL query analyzer) with hints about how to improve the query execution.
Memory-bound partitions – Again related to performance, it will be great if you could configure a partition to be memory-bound for super-fast access, as I mentioned in this blog.
Detail reporting – I wish Analysis Services improves the ability to report on detail level. For example, it will nice to support text measures that the server returns for the lowest grain. I also want detail queries, such as a query that returns accounts for given customer to perform faster and don’t give up with “The expression contains a function that cannot operate on a set with more than 4,294,967,296 tuples.” error.
Resource governor – Analysis Services should expand on letting the administrator manage resources, such as memory, connections, query timeouts, etc.
Custom security – Support custom authentication that is not Windows-based to facilitate Internet connectivity perhaps similar to custom security in Reporting Services.
Modeling enhancements – OK, this is a catch-all bucket for support issues that I logged and which were declared as “by design” and “future enhancements” [:D], such as aggregatable Many-to-Many relationships, fixing subselect issues, fixing exclusion filter with custom operator issue.
Happy holidays!
https://prologika.com/wp-content/uploads/2016/01/logo.png00Prologika - Teo Lachevhttps://prologika.com/wp-content/uploads/2016/01/logo.pngPrologika - Teo Lachev2009-12-07 18:27:002016-02-17 06:31:26Analysis Services Top 10 Wish List
Reporting Services has gone a long way for the past five years and it’s getting better. In the spirit of the season, here is my Reporting Services Top 10 Wish List revised from three years ago. This list is based on my work, so your priorities may differ.
Improved Analysis Services integration – Since its debut in SSRS 2005, the MDX query designer hasn’t changed. R2 continues the trend, so no hope until at least 2011, that’s six years! Yet, the MDX query designer has plenty of deficiencies and bugs to be addressed, such query schema limitations, poor support for parent-child hierarchies, parameter limitations, and so on. I use SSAS heavily in my real-life projects and have to battle these deficiencies on a daily basis. I think it’s time for Microsoft to poll customers and MVPs for feedback and improve the integration with SSAS.
Eventing model – Although SSRS 2008 introduced a Report Definition Customization Extension (RDCE) that lets you change the report definition when the report requested, this extensibility mechanism was added as an afterthought and it’s somewhat kludgy. What’s really needed is server-side events, such as OnReportRender, OnPrint, OnParameterLoad, etc., similar to the ASP.NET programming model. Imagine the flexibility you will have as a report author if the server raises events for various stages of report processing and passes the report definition to let you evaluate conditions and change collections and RDL on the fly.
Supported RDL Object Model – After promising an RDL object model at TechEd 2007, SSRS 2008 brought an unsupported version but R2 is on its way to “undo” it by making it publicly inaccessible. At the same time, there are many requirements that call for pre-processing report definitions. A supported RDL object model will definitely simplify this.
Silverlight-based Report Viewer – Silverlight established itself as a platform of choice for web-based development. A Sliverlight Report Viewer will be a welcome addition.
More interactive reporting – Currently, SSRS requires you to make design changes and preview them. It will be great if a future release blurs design and preview to support more interactive reporting similar to Excel PivotTable.
Dataset enhancements, such as ability to navigate dataset rows and joining datasets at report level.
More user-friendly ad-hoc reporting – Report Builder 2.0/3.0 is one my favorite features that SSRS 2008/R2 brought in. However, some end-user oriented features from Report Builder 1.0 got “lost” along the way. This item is about these features, such as making it easier for the end user to filter report data. When connected to SSAS, for example, SSRS should be as user-friendly as Excel.
ADO.NET dataset binding for server reports – I keep on asking for this feature and I still think it could be very useful to be able to pass ADO.NET datasets to published reports without having to build a custom dataset extension.
Report styling – Ability to style and skin reports.
Decoupling the Report Builder Designer and exposing it as a reusable .NET control which can be embedded in applications.
Happy holidays!
https://prologika.com/wp-content/uploads/2016/01/logo.png00Prologika - Teo Lachevhttps://prologika.com/wp-content/uploads/2016/01/logo.pngPrologika - Teo Lachev2009-12-07 13:55:002021-02-16 03:46:29Reporting Services Top 10 Wish List
In case you’ve missed this, the Pivot era has begun. After Excel PivotTable and PivotChart, we’ll have PowerPivot in SQL Server 2008 R2. But Pivot evolves… A co-worker showed me today a glimpse of the Pivot future which I guess is the Microsoft Live Labs Pivot. Since grids and charts are not cool anymore we now have pictures and animation. It’s hard for me to understand at this point how this would apply to Business Intelligence but the Silverlight app with all these pictures sure looks catchy.
Now that I’ve got my copy and read it, I can say a few things about the book Expert Cube Development with Microsoft SQL Server 2008 Analysis Services by Chris Webb, Alberto Ferrari, and Marco Russo. As mentioned in another post, the authors (all MVPs and prominent SSAS experts) don’t disappoint and you won’t go wrong picking up this book. The book is somewhat small in size (330 pages) but big in wisdom and best practices. It also includes plenty of references to external resources and blogs that the authors and other SSAS experts have written when you need further understanding of the topics discussed. Make no mistake though, this is not a step-by-step book and it doesn’t target novice users. As its title suggests, the book is geared toward more advanced users who have a few years of SSAS experience under their belt and are thirsty for more insightful knowledge.
Chapter 1 Designing the Data Warehouse for Analysis Services
The first and most important step for implementing a successful Analysis Services solution has nothing to do with Analysis Services at all. Its success depends on a solid schema design on which you’ll build the cube so the book is right on target to hit this topic first. Chapter 1 discusses common schema modeling challenges and provides plenty of tips to tackle them. One grudge I have here is about the following sentence “Beware of the temptation to avoid building a data warehouse and data marts” which may leave the reader with the impression that a data mart is a must. In fact, call me lazy but the first thing that I’d explore when starting a new SSAS project is if it’s possible to avoid a separate database. While a classic OLAP solution in many cases will require a new database (whatever you call it a data warehouse or a data mart) and the whole ETL enchilada that this entails, you may need to build a cube on top of simpler schemas, such on top of a DSS (decision support system) schema. In this case, I would explore the option to “dimensionalize” the source schema with a layer of SQL views. As with everything else, the keep-it-simple principle works for me.
Chapter 2 Basic Dimensions and Cubes
This chapter discusses the groundwork required to set up the raw dimensional model. This includes working with data sources, data source views, cubes, and dimensions. My favorite part of this chapter was the attribute design and setting up attribute relations. This often overlooked aspect of SSAS development is crucial for achieving good performance and the book explains why.
Chapter 3 Designing More Complex Dimensions
Next, the book explains how to handle more complex dimension schemas and hierarchies. This includes parent-child, ragged, slowly-changing, referenced, fact, and junk dimensions. The authors’ real-life experience shows through. About junk dimensions, my preference is to avoid them wherever possible for performance reasons. Instead, I’d explore the option to keep the low-cardinality attributes in the fact table and use report or URL actions to view them. In my opinion, SSAS is not there yet as far as reporting on details.
Chapter 4 Measures and Measure Groups
The whole purpose of building a cube is to aggregate measures. Analysis Services supports various aggregation functions and the book provides essential coverage. You will learn how to implement semi-additive measures if you cannot afford the Enterprise Edition of SQL Server. Custom aggregation by using unary operators and custom member formulas are presented too. Then the book discusses more complex relationship types, including different grains, linked dimensions and measure groups, role-playing dimensions and fact relationships.
Chapter 5 Adding Transactional Data
Although most users would be interested in aggregated data, sometimes users may need to see the level of details behind a cell. The book explains how you can do this by using drillthrough and actions. Drillthrough options are covered in great details. Excellent coverage is provided for many-to-many relationships as well.
Chapter 6 Adding Calculations to the Cube
Cubes usually include business calculations in the form of MDX expressions. Chapter 6 gives lays the foundation for using MDX. It provides practical examples for calculated members, including YTD, ratios, growths, same period last previous year, moving averages, and ranks. Handling relative dates is a common business requirement. For example, I personally had to implement two custom types of relative dates as explained in this blog. The book provides a great example for implementing a custom calculation dimension for implementing more flexible relative dates that the BI Wizard provides. Finally, the chapter discusses static and dynamic named sets.
Chapter 7 Adding Currency Conversion
I consider myself lucky for never having to support international users because of the complexities surrounding the issue. If you have to, SSAS gives you the necessary features to tackle various localization requirements. This chapter walks you through the details of implementing currency conversion using the BI wizard, measure expressions, and writeback. My advice is to avoid writeback due to its limitations. Instead, consider an URL action that navigates the user to a custom web page for handing data changes and proactive caching for automatically updating the cube.
Chapter 8 Query Performance Tuning
SSAS bends backwards to provide great performance. You can help by following best practices for cube design. This chapter teaches you how to implement partitions and aggregations. I like the sections for monitoring partition and aggregation usage and building aggregations manually. The chapter presents useful tips to diagnose and resolve performance issues, such as by using the MDX Studio, named sets, calculated members, and caching.
Chapter 9 Securing the Cube
Chances are you will need to provide restricted access to the cube for groups of users. This chapter shows you how to implement and test roles. It covers cell and dimension security. It presents solutions for implementing custom dimension data security which are similar to the ones I discussed in this article.
Chapter 9 Productionization
Your SSAS solution is ready and it’s time to see daylight. This chapter covers the tasks associated with deploying and managing your SSAS solution in production environment. These include managing and generating partitions and processing. I liked the coverage of different processing options.
Chapter 10 Monitoring Cube Performance and Usage
As an administrator, your job doesn’t end once the solution is deployed. You need to monitor it on a daily basis to ensure that it performs optimally. The last chapter explains different server monitoring techniques, such as performance counters, tracing, Resource Monitor, SQL Profiler, and using Dynamic Management Views (DMVs). I personally liked the memory management tips.
In summary, I highly recommend this book to anyone who has several years of experience in SSAS development and need a compass check to make sure that he follows the right track. Kudos to the authors for taking time to write it!
https://prologika.com/wp-content/uploads/2016/01/logo.png00Prologika - Teo Lachevhttps://prologika.com/wp-content/uploads/2016/01/logo.pngPrologika - Teo Lachev2009-12-02 14:00:002016-02-17 06:36:08Expert Cube Development with Analysis Services 2008
 Now that I’ve got my copy and read it, I can say a few things about the


