CTP3 Issues with PowerPivot Management Dashboard

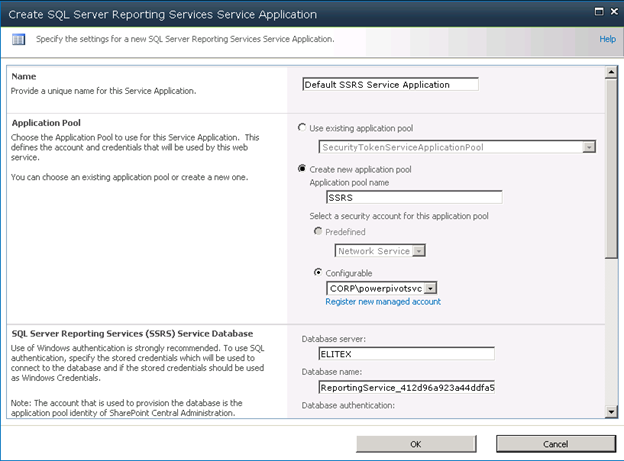
I ran into a couple of snags with the PowerPivot Management Dashboard and CTP3 of Denali. In this case, I’ve installed PowerPivot for SharePoint on a standalone domain controller.

  1. The Actions web part of the PowerPivot Management Dashboard refuses to load with the following exception logged in the SharePoint URL log ” Unable to acquire information about the NT group ‘Enterprise Admins'”
    Resolution: This is a known issue that will be fixed in RTM. The workaround is to (1) delete any accounts that display their SIDs, i.e. they were part of a domain that is no longer valid, and (2) to delete any universal or enterprise groups
    Connect item: https://connect.microsoft.com/SQLServer/feedback/details/685945/system-exception-unable-to-acquire-information-about-the-nt-group-enterprise-admins
  2. The dashboard doesn’t display any data although usage data is collected. This is caused by the fact that the PowerPivot system account doesn’t have rights to the PowerPivot SQL database and the timer job fails. The SQL Profiler shows the following error “The SELECT permission was denied on the object ‘vHealth’, database ‘DefaultPowerPivotServiceApplicationDB’, schema ‘Usage’. An error occurred while processing the ‘Health’ table.”
    Resolution: Grant the PowerPivot system account rights to all tables and views in the PowerPivot database
    Connect item: https://connect.microsoft.com/SQLServer/feedback/details/685955/no-data-in-powerpivot-management-dashboard-due-to-insufficient-rights


Reporting Services "Denali" Brings Export to Excel 2007

One welcome improvement in the forthcoming “Denali” release of Reporting Services is exporting to Excel 2007 (*.xlsx) file formats. I bet many companies will upgrade just to get this feature. In fact, the default rendering option when you export to Excel is to xlsx. The old Excel 2003 renderer is still there but it’s hidden by default. And, yes, BI projects now integrate with Visual Studio 2010!

For more details about Excel 2007 rendering, please read the Exporting to Microsoft Excel (Report Builder 3.0 and SSRS) topic in BOL.

082011_1609_ReportingSe1

082011_1609_ReportingSe2

Reporting Services SharePoint Integration in SQL Server Denali

A week ago, I raved about how the new PowerPivot Configuration Tool would simplify configuring PowerPivot for SharePoint. Guess what? Setting up Reporting Services for SharePoint integrated mode got simplified too! In SQL Server Denali, Reporting Services leverages the SharePoint service application infrastructure and it doesn’t require installing a Reporting Services server. Not only this simplifies setup but improves performance because there is no round-tripping between SharePoint and report server anymore. Configuring Reporting Services for SharePoint integration mode is a simple process that requires the following steps:

  1. Run the SQL Server Denali CTP3 setup and Install Reporting Services and the add-in on the SharePoint application server.081411_2142_ReportingSe1
  2. Once the bits are installed, open SharePoint Central Administration, and click Manage Service Applications. Expand the New button and click SQL Server Reporting Services Service application.081411_2142_ReportingSe2
  3. In the page that follows, configure the service application details as per your specific environment and click OK.081411_2142_ReportingSe3
  4. As with the previous releases, one more step is required to enable the SSRS content types in a given document library.

    a) Go to the document library settings page and click Advanced Settings. In the Advanced Settings page, select Yes for the Allow management of content types?

    081411_2142_ReportingSe4

    b) Back to the document library settings page, click the Add from Existing Site Content Types link.
    081411_2142_ReportingSe5
    c) In the Add Content Types page, add BISM Connection File (assuming PowerPivot for SharePoint is configured), and the Report Builder content types.

    081411_2142_ReportingSe6

Voila! Once this is done, you can create Crescent reports. You just need to create a BISM Connection File that points to a PowerPivot model or BISM Tabular model.

081411_2142_ReportingSe7

Transactional Reporting with BISM Tabular

Continuing on BISM Tabular performance (see my Cube vs. VertiPaq Query Performance blog), I was disappointed to find that there are no performance improvements in PowerPivot/BISM Tabular in CTP3 in the area of detailed (transactional-level) reporting which has plagued me since the R2 release. Consider the following report build on top of an Adventure Works PowerPivot model.


This report shows all Adventure Works customers and their order information by combining data from the Customer (18,000 rows) and InternetSales (60,000 rows) tables. Specifically, the report includes two columns from the Customer table and four columns from the InternetSales table. The report has a slicer to let the user filter a customer. Given that PowerPivot is an end-user tool it’s likely that end users would build such reports.

Unfortunately, each time you click the slicer or filter a column, the report query takes about ten minutes (!) to execute. One would surely expect better performance from the “engine of the devil”. To be fair to VertiPaq, Excel OLAP PivotTable is designed for summarized reports and not transactional reports. I am not excluding the possibility of a bug in the VertiPaq engine because a similar report connected to the Adventure Works cube takes milliseconds to execute. Here is the MDX statement generated by PowerPivot report when I filter on Aaron:

SELECT {[Measures].[Sum of OrderQuantity 2],[Measures].[Sum of SalesAmount 2]} DIMENSION PROPERTIES PARENT_UNIQUE_NAME,HIERARCHY_UNIQUE_NAME ON COLUMNS , NON EMPTY Hierarchize(DrilldownMember(DrilldownMember(DrilldownMember(CrossJoin({[Customer].[FirstName].[All],[Customer].[FirstName].[FirstName].AllMembers}, {([Customer].[LastName].[All],[InternetSales].[SalesOrderNumber].[All],[InternetSales].[SalesOrderLineNumber].[All])}), [Customer].[FirstName].[FirstName].AllMembers, [Customer].[LastName]), [Customer].[LastName].[LastName].AllMembers, [InternetSales].[SalesOrderNumber]), [InternetSales].[SalesOrderNumber].[SalesOrderNumber].AllMembers, [InternetSales].[SalesOrderLineNumber])) DIMENSION PROPERTIES PARENT_UNIQUE_NAME,HIERARCHY_UNIQUE_NAME ON ROWS FROM (SELECT ({[Customer].[FirstName].&[Aaron]}) ON COLUMNS FROM [Sandbox]) CELL PROPERTIES VALUE, FORMAT_STRING, LANGUAGE, BACK_COLOR, FORE_COLOR, FONT_FLAGS

We would probably need to wait for the next version of Office to fix this performance issue at its core. Meanwhile, avoid Excel pivot reports and consider Crescent for detail-level reporting. Crescent generates native DAX queries and I verified that detail-level reporting is efficient.

Please vote for the connect feedback I’ve submitted on this subject.

UPDATE 8/14/2011

The slowdown is caused by the subselects added to the MDX query when applying a slicer or column filtering. Specifically, when the query requests calculations, the server applies Autoexists before doing NON EMPTY which could be rather expensive over a large space. Filtering on a field added to the Report Filter zone is very fast because the query uses a WHERE clause.

PowerPivot Configuration Tool

One great enhancement in SQL Server 11 (Denali) is the PowerPivot for SharePoint setup refactoring. Previously, the PowerPivot for SharePoint setup and configuration was included and performed at the end of the SQL Server setup. Consequently, it was very difficult to figure out what went wrong. In Denali, you need to perform the PowerPivot for SharePoint configuration as a post-installation step after the SQL Server setup completes. You can do this using the new PowerPivot Configuration Tool, SharePoint Central Administration, or PowerShell.

You can find the PowerPivot Configuration Tool in the SQL Server Denali CTP3 ð Configuration Tools program group. When you open the tool, it examines the SharePoint setup and presents a list of tasks (if any) that need to be done to configure PowerPivot for SharePoint so it’s operational. Once you validate the tasks and run them, the tool would perform the steps one at a time and indicate which step is currently taking place. You can select task and click the Script tab to see a PowerShell script for that task or the Output tab to see an execution log.

If a step fails, the tool stops and the rest of the steps are not executed. You need to examine what went wrong, fix it, and rerun the tool to execute the remaining tasks. You can also use the tool to remove features, services, applications. and solutions.

080811_0126_Transaction1

SharePoint is great product but it’s also very complex and difficult to troubleshoot. The PowerPivot Configuration Tool will simplify the management effort to configure PowerPivot for SharePoint.