Programming MapReduce Jobs with HDInsight Server for Windows

In a previous blog “Installing HDInsight Server for Windows”, I introduced you to the Microsoft HDInsight Server for Windows. Recall that HDInsight Server for Windows is a Windows-based Hadoop distribution that offers two main benefits for Big Data customers:

  • An officially supported Hadoop distribution on Windows server – Previously, you can set up Hadoop on Windows as an unsupported installation (via Cygwin) for development purposes. What this means for you is that you can now set up a Hadoop cluster on servers running Windows Server OS.
  • Extends the reach of the Hadoop ecosystem to .NET developers by allowing them to write MapReduce jobs in .NET code, such as C#.

And, in previous blogs, I’ve introduced you to Hadoop. Recall that there are two main reasons for using Hadoop for storing and processing Big Data:

  • Storage – You can store massive files in a distributed and fault-tolerant file system (HDFS) without worrying that hardware failure will result in a loss of data.
  • Distributed processing – When you outgrows the limitations of a single server, you can distribute job processing across the nodes in a Hadoop cluster. This allows you to perform crude data analysis directly on files stored in HDFS or execute any other type of jobs that can benefit from a parallel execution.

This blog continues the HDInsight Server for Windows journey. As many of you probably don’t have experience in Unix or Java, I’ll show you how HDInsight makes it easy to write MapReduce jobs on a Windows machine.

Note Writing MapReduce jobs can be complex. If all you need is performing some crude data analysis, you should consider an abstraction layer, such as Hive, which is capable for deriving the schema and generating the MapReduce jobs for you. This doesn’t mean that experience in MapReduce is not useful. When processing the files go beyond just imposing a schema on the data and querying the results , you might need programming logic, such as in The New York Times Archive case.

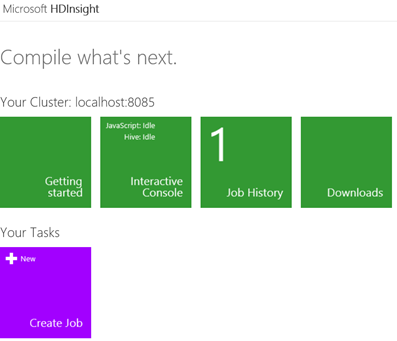
As a prerequisite, I installed HDInsight on my Windows 8 laptop. Because of its prerelease status, the CTP of HDInsight Server for Windows currently supports a single node only which is fine for development and testing. My task is to analyze the same dataset that I used in the MS BI Guy Does Hadoop (Part 2 – Taking Hadoop for a Spin) blog. The dataset (temp.txt) contains temperature readings from weather stations around the world and it represents the weather datasets kept by National Climatic Data Center (NCDC). You will find the sample dataset in the source code attached to this blog. It has the following content (the most important parts are highlighted in red: the year found in offset 15 and temperature found in offset 88).

0067011990999991950051507004+68750+023550FM-12+038299999V0203301N00671220001CN9999999N9+00001+99999999999

0043011990999991950051512004+68750+023550FM-12+038299999V0203201N00671220001CN9999999N9+00221+99999999999

0043011990999991950051518004+68750+023550FM-12+038299999V0203201N00261220001CN9999999N9-00111+99999999999

0043012650999991949032412004+62300+010750FM-12+048599999V0202701N00461220001CN0500001N9+01111+99999999999

0043012650999991949032418004+62300+010750FM-12+048599999V0202701N00461220001CN0500001N9+00781+99999999999

Note that the data is stored in its raw format and no schema was imposed on the data. The schema will be derived at runtime by parsing the file content.

Installing Microsoft .NET SDK for Hadoop

The Microsoft .NET SDK for Hadoop facilitates the programming effort required to code MapReduce jobs in .NET. To install it:

  1. Install NuGet first. NuGet is a Visual Studio extension that makes it easy to add, remove, and update libraries and tools in Visual Studio projects that use the .NET Framework.
  2. Open Visual Studio (2010 or 2012) and create a new C# Class Library project.
  3. Go to Tools ð Library Package Manager ð Package Manager Console.
  4. In the Package Manager Console window that opens in the bottom of the screen, enter:
    install-package Microsoft.Hadoop.MapReduce –pre

    This command will download the required Hadoop binaries and add them as references in your project.

Coding the Map Job

The Map job is responsible for parsing the input (the weather dataset), deriving the schema from it, and generating a key-value pair for the data that we’re interested in. In our case, the key will be the year and the value will be the temperature measure for that year. The Map class derives from the MapperBase class defined in Microsoft.Hadoop.MapReduce.dll.

122812_2018_Programming1

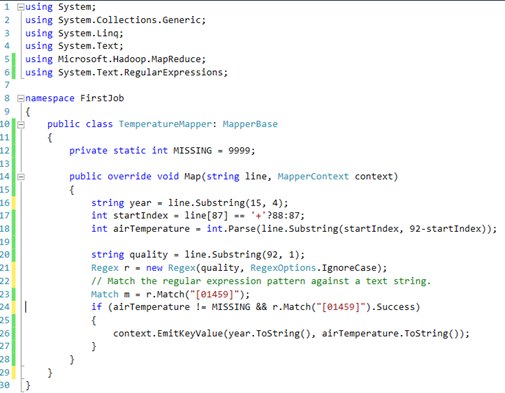
At runtime, HDInsight will parse the file content and invoke the Map method once for each line in the file. In our case, the Map job is simple. We parse the input and extract the temperature and year. If the parsing operation is successful, we return the key-value pair. The end result will look like this:

(1950, 0)

(1950, 22)

(1950, 11)

(1949, 111)

(1949, 78)

Coding the Reduce Job

Suppose that we want to get the maximum temperature for each year. Because each weather station might have multiple readings (lines in the input file) for the same year, we need to combine the results and find the maximum year. This is analogous to GROUP BY in SQL. The following Reduce job gets the work done:

122812_2018_Programming2

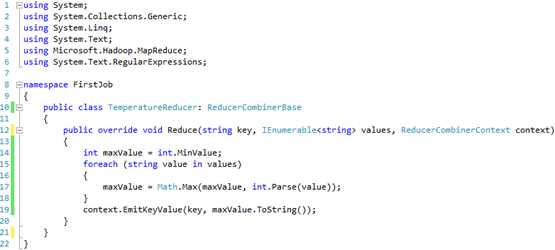
The Reduce job is even simpler. The Hadoop framework pre-processed the output of the Map jobs before it’s sent to the Reduce function. This processing sorts and groups the key-value pairs by key, so the input to the Reduce job will look like this:

(1949, [111, 78])

(1950, [0, 22, −11])

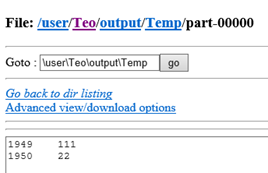
In our case, the only thing left for the Reduce job is to loop through the values for a given key (year) and return the maximum value, so the final output will be:

(1949, 111)

(1950, 22)

Testing MapReduce

Instead of deploying to Hadoop each time you make a change during the development and testing lifecycle, you can add another project, such as a Console Application, and use it as a test harness to test the MapReduce code. For your convenience, Microsoft provides a StreamingUnit class in Microsoft.Hadoop.MapReduce.dll. Here is what our test harness code looks like:

122812_2018_Programming3

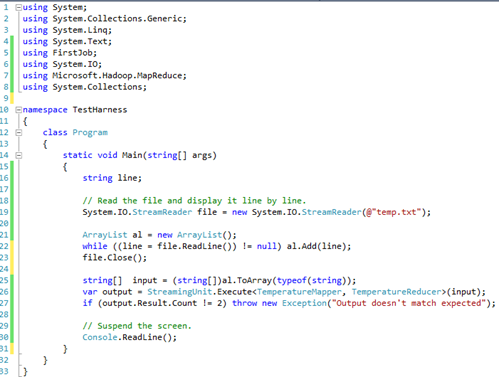
The code uses a test input file. It reads the content of the file one line at the time and adds each line as a new element to an instance of ArrayList. Then, the code calls the StreamInsight.Execute method to initiate the MapReduce job.

Deploying to Hadoop

Once the code is tested, it’s time to deploy the dataset and MapReduce jobs to Hadoop.

  1. Deploy the file to the Hadoop HDFS file system.
    C:\Hadoop\hadoop-1.1.0-SNAPSHOT\bin>hadoop fs -copyFromLocal D:\MyApp\Hadoop\MapReduce\temp.txt input/Temp/input.txt

Note When you execute the hadoop command shell in the previous step, the file will be uploaded to your folder. However, if you use the JavaScript interactive console found in the HDInsight Dashboard, the file will be uploaded to the Hadoop folder in HDFS because the console runs under the hadoop user. Consequently, the MapReduce job won’t be able to find the file. So, you use the hadoop command prompt.

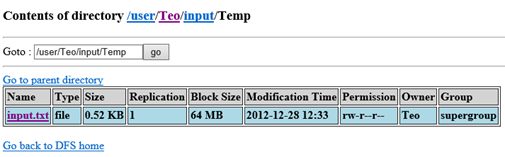
      2.   Browse the file system using the web interface (http://localhost:50070) to see that the file is in your folder.

122812_2018_Programming4

3.     Finally, we need to execute the job with HadoopJobExecutor, which be called in various ways. The easiest way is to use MRRunner
D:\MyApp\Hadoop\MapReduce\FirstJob\bin\Debug>.\mrlib\mrrunner -dll FirstJob.dll

D:\MyApp\Hadoop\MapReduce\FirstJob\bin\Debug>.\mrlib\mrrunner -dll FirstJob.dll

File dependencies to include with job:[Auto-detected] D:\MyApp\Hadoop\MapReduce\FirstJob\bin\Debug\FirstJob.dll

[Auto-detected] D:\MyApp\Hadoop\MapReduce\FirstJob\bin\Debug\Microsoft.Hadoop.MapReduce.dll

[Auto-detected] D:\MyApp\Hadoop\MapReduce\FirstJob\bin\Debug\Newtonsoft.Json.dll

>>CMD: c:\hadoop\hadoop-1.1.0-SNAPSHOT\bin\hadoop.cmd jar c:\hadoop\hadoop-1.1.0-SNAPSHOT\lib\hadoop-streaming.jar -D “mapred.map.max.attempts=1” -D “mapred.reduce.max.attempts=1” -input inpu

emp -mapper ..\..\jars\Microsoft.Hadoop.MapDriver.exe -reducer ..\..\jars\Microsoft.Hadoop.ReduceDriver.exe -file D:\MyApp\Hadoop\MapReduce\FirstJob\bin\Debug\MRLib\Microsoft.Hadoop.MapDriver.e

p\MapReduce\FirstJob\bin\Debug\MRLib\Microsoft.Hadoop.ReduceDriver.exe -file D:\MyApp\Hadoop\MapReduce\FirstJob\bin\Debug\MRLib\Microsoft.Hadoop.CombineDriver.exe -file “D:\MyApp\Hadoop\MapRedu

irstJob.dll” -file “D:\MyApp\Hadoop\MapReduce\FirstJob\bin\Debug\Microsoft.Hadoop.MapReduce.dll” -file “D:\MyApp\Hadoop\MapReduce\FirstJob\bin\Debug\Newtonsoft.Json.dll” -cmdenv “MSFT_HADOOP_MA

-cmdenv “MSFT_HADOOP_MAPPER_TYPE=FirstJob.TemperatureMapper” -cmdenv “MSFT_HADOOP_REDUCER_DLL=FirstJob.dll” -cmdenv “MSFT_HADOOP_REDUCER_TYPE=FirstJob.TemperatureReducer”

packageJobJar: [D:\MyApp\Hadoop\MapReduce\FirstJob\bin\Debug\MRLib\Microsoft.Hadoop.MapDriver.exe, D:\MyApp\Hadoop\MapReduce\FirstJob\bin\Debug\MRLib\Microsoft.Hadoop.ReduceDriver.exe, D:\MyApp

Job\bin\Debug\MRLib\Microsoft.Hadoop.CombineDriver.exe, D:\MyApp\Hadoop\MapReduce\FirstJob\bin\Debug\FirstJob.dll, D:\MyApp\Hadoop\MapReduce\FirstJob\bin\Debug\Microsoft.Hadoop.MapReduce.dll, D

e\FirstJob\bin\Debug\Newtonsoft.Json.dll] [/C:/Hadoop/hadoop-1.1.0-SNAPSHOT/lib/hadoop-streaming.jar] C:\Users\Teo\AppData\Local\Temp\streamjob7017247708817804198.jar tmpDir=null

12/12/28 12:35:20 WARN util.NativeCodeLoader: Unable to load native-hadoop library for your platform… using builtin-java classes where applicable

log4j:ERROR Failed to rename [C:\Hadoop\hadoop-1.1.0-SNAPSHOT\logs/hadoop.log] to [C:\Hadoop\hadoop-1.1.0-SNAPSHOT\logs/hadoop.log.2012-12-27].

12/12/28 12:35:20 WARN snappy.LoadSnappy: Snappy native library not loaded

12/12/28 12:35:20 INFO mapred.FileInputFormat: Total input paths to process : 1

12/12/28 12:35:20 INFO streaming.StreamJob: getLocalDirs(): [c:\hadoop\hdfs\mapred\local]

12/12/28 12:35:20 INFO streaming.StreamJob: Running job: job_201212271510_0010

12/12/28 12:35:20 INFO streaming.StreamJob: To kill this job, run:

12/12/28 12:35:20 INFO streaming.StreamJob: C:\Hadoop\hadoop-1.1.0-SNAPSHOT/bin/hadoop job -Dmapred.job.tracker=localhost:50300 -kill job_201212271510_0010

12/12/28 12:35:20 INFO streaming.StreamJob: Tracking URL: http://127.0.0.1:50030/jobdetails.jsp?jobid=job_201212271510_0010

12/12/28 12:35:21 INFO streaming.StreamJob: map 0% reduce 0%

12/12/28 12:35:38 INFO streaming.StreamJob: map 100% reduce 0%

12/12/28 12:35:50 INFO streaming.StreamJob: map 100% reduce 100%

12/12/28 12:35:56 INFO streaming.StreamJob: Job complete: job_201212271510_0010

12/12/28 12:35:56 INFO streaming.StreamJob: Output: output/Temp

4.   Using the web interface or the JavaScript console, go to the output folder and view the part-00000 file to see the output (should match your testing results).

122812_2018_Programming5

Happy Holidays!

As another year is winding down, it’s time to review and plan ahead. 2012 was a great year for both Prologika and BI. On the business side of things, we achieved Microsoft Gold BI and Silver Data Platform competencies. We added new customers and consultants. We completed several important projects with Microsoft acknowledging two of them.

2012 was an eventful year for Microsoft BI. SQL Server 2012 was released in March. It added important BI enhancements, including Power View, PowerPivot v2, Reporting Services End-User Alerting, Analysis Services in Tabular mode, Data Quality Services, Integration Services enhancements, MDS Add-In for Excel, Reporting in the Cloud, and self-service BI for Big Data with the Excel Hive add-in. The next BI wave came with Office 2013 and added important organizational and self-service BI features, including PowerPivot Integration in Excel 2013, Power View Integration in Excel 2013, Excel updatable web reports in SharePoint, productivity enhancements (Flash Fill, Quick Explore, Quick Analysis, and so on), PerformancePoint theming support and enhanced filtering, better mobile BI support, and self-service BI in Office 365.

Microsoft added support for Big Data and Hadoop both on cloud with HDInsight Service and on-premises with the CTP release of HDInsight Server. Finally, we got the public prerelease bits of DAXMD to connect Power View to multidimensional cubes.

As we witnessed, BI is a very important part of the Microsoft data strategy. Although overwhelming in times, I hope the trend will continue in 2013 and beyond. In the spirit of the season, here is my top 5 wish list:

  1. Continuing focus on integration and simplification – Fast-paced in nature, Microsoft BI has grown in complexity and redundancy through evolution and product acquisitions. Personally, I’d like to see further unification of the Multidimensional and Tabular models, so BI pros don’t have to choose which path to take and what compromise to make. Integration opportunities exist in other areas, such DQS and MDS, as well Tabular native support in the client tools (Excel and SSRS).
  2. Extending mobile BI reach – Customers are asking for it.
  3. Easier and simpler self-service BI – Excel 2013 has started the path but I think we can do a better job to simplify the user experience and compete more successfully with other self-service BI vendors.
  4. BI in the cloud – This will enable interesting scenarios and extend the reach of BI products and services.
  5. Enterprise lineage and change impact analysis – I think it’s about time to have this.

Most importantly, I hope to see Microsoft B having a renewed focus on customers in 2013. We should be listening more to our customers as sometimes as geeks we tend to be too much caught up in technology and we learn our lesson the hard way.

Stay happy and healthy in 2013!

122612_0146_HappyHolida1


DAXMD Goes Public!

Microsoft announced yesterday the availability of the Community Technology Preview (CTP) of Microsoft SQL Server 2012 With Power View for Multidimensional Models (aka DAXMD). As a participant of the CTP program and I’m very excited about this enhancement. Now customers can leverage their investment in OLAP and empower business users to author Power View ad-hoc reports and dashboards from Analysis Services cubes. Previously, Power View supported only PowerPivot workbooks or Analysis Services Tabular models as data sources. I’m not going to repeat what T.K. Anand said in the announcement. Instead, I want to emphasize a few key points:

  1. This CTP applies only to the SharePoint-version of Power View. Excel 2013 customers need to wait for another release vehicle to be able to connect Power View in Excel 2013 to cubes.
  2. You’ll need to upgrade both the SharePoint server and SSAS server because enhancements were made in both Power View and SSAS.
  3. Although not supported, I successfully tested that you can install the CTP on top of SQL Server 2012 SP1.
  4. The CTP will not be upgradable to RTM.
  5. It’s not known at this point when and how the RTM bits will ship.
  6. DAXMD doesn’t translate DAX queries to MDX. Instead, the DAX queries are handled natively on the server and performance is awesome!

Kudos to the SSAS and SSRS teams for listening to customers and working together on this feature!

Atlanta BI Group Meeting on Monday, December 3rd

I’ll be presenting What’s New in Excel 2013 and SharePoint 2013 BI at our Atlanta BI Group on Monday, December 3rd.

Microsoft has recently released the 2013 version of Excel and SharePoint. Both technologies include major enhancements for self-service and organizational BI. Join us to review these new features. Learn how business users can quickly analyze and understand data in Power Pivot which is now natively supported by Excel. See how Power View enables rich data visualization and having fun with data both on the desktop and server. Understand the new Excel and SharePoint features for organizational BI that opens new opportunities for analyzing OLAP and Tabular models.

Geocoding with Power View Maps

As I wrote before, Power View in Excel 2013 and SharePoint with SQL Server 2012 SP1 supports mapping. The map region supports geocoding and it allows you to plot addresses, countries, states, etc, or pairs of latitude-longitude coordinates. The key for getting this to work is to mark the columns with appropriate categories.

  1. Using latitude-longitude

If you have a SQL Server table with a Geography data type, you can extract the latitude and longitude as separate columns.

SELECT SpatialLocation.Lat, SpatialLocation.Long FROM Person.Address

Once you import the dataset in PowerPivot, make sure to categorize the columns using the Advanced tab.

112912_1308_Geocodingwi1

The map region doesn’t support grouping on latitude-longitude so you can’t just place them in the Latitude-Longitude zones and expect it work. Instead, you have to add another field, such as address or both the Latitude-Longitude combination to the Location field. The map groups on the Location zone but uses the Latitude and Longitude to place the points.

112912_1308_Geocodingwi2


  1. Address geocoding


    If you don’t have Latitude-Longitude, the map is capable of geocoding full addresses. Again, the trick here is to categorize the FullAddress column as Address. However, if you have invalid addresses, you’ll find that the map won’t show them. Instead, categorize the column as Place, which you can find in the More Categories section (thanks to Sean Boon from the Reporting Services team for the tip).


    112912_1308_Geocodingwi3


    The map passes to Bing the fact that the field is mapped as Address so it should plot whatever we get back from Bing. The Bing Maps web experience isn’t identical to the API as you can’t pass the Address hint to Bing in the web experience. The Place category is more liberal in terms of what it will attempt to plot.


    112912_1308_Geocodingwi4

Book Review “Microsoft SQL Server 2012 Analysis Services – The BISM Tabular Model”

I’ve recently had the pleasure to read the book “Microsoft SQL Server 2012 Analysis Services – The BISM Tabular Model” by Marco Russo, Alberto Ferrari, and Chris Webb. The authors don’t need an introduction and their names should be familiar to any BI practitioner. They are all well-known experts and fellow SQL Server MVPs who got together again to write another bestseller after their previous work “Expert Cube Development with Microsoft SQL Server 2008 Analysis Services”. The latest book was published about five months after my book “Applied Microsoft SQL Server 2012 Analysis Services: Tabular Modeling”. Although both books are on the same topic, we didn’t exchange notes when starting on the book projects. In fact, I was well into writing mine when I learned on the SSAS insider’s discussion list about the trio’s new project. Naturally, you might think that the books compete with each other but after reading Microsoft SQL Server 2012 Analysis Services – The BISM Tabular Model” I agree with Marco and Chris that the books actually complement each other pretty well.

A central theme of my book is the continuum of Self-service, Team, and Organizational BI. I felt that it is very important to show how Tabular addresses the needs of both business users and BI pros. Indeed, the Tabular journey can start very unassuming, perhaps with a business user creating a simple personal model, gains popularity and evolves to a deployed model shared by teammates, and finally to a corporate model that is provisioned and sanctioned by IT. Because of this, the first part of the book covers PowerPivot for Excel, the second covers PowerPivot for SharePoint, and the third part covers Analysis Services Tabular. Since my book naturally targets different reader audiences (business users, power BI users, and BI pros), I felt that it was imperative to lower the learning curve as much as possible, such as providing step-by-step instructions for the exercises and video tutorials. Writing a book that targets such a broad base is not easy. To make sure that the book will be well accepted, I had readers who represented each of these groups review the manuscript and provide feedback.

On the other hand, Microsoft SQL Server 2012 Analysis Services – The BISM Tabular Model focuses on the professional side of Analysis Services Tabular and targets mainly BI pros. More than half of the book is devoted on DAX and you’ll be hard pressed to find a better coverage on this topic (a note to myself that DAX deserves more attention if I ever write a revision). Besides DAX, Microsoft SQL Server 2012 Analysis Services – The BISM Tabular Model covers equally well other aspects of Tabular and the author’s real life experience shows through. My favorite chapters are Chapter 11 “Data Modeling in Tabular” and Chapter 12 “Using Advanced Tabular Relationships”.

All in all, any serious BI pro willing to learn Tabular should have this book on the shelf… I hope next to mine.

SQL PASS 2012 Day 1 Announcements

I hope you watched the SQL PASS 2012 Day 1 Keynote live. There were important announcements and I was sure happy to see BI being heavily represented. For me, the most important ones were:

  1. The availability of SQL Server 2012 Service Pack 1

For some reason, this announcement went without being applauded from the audience although in my opinion it was the most important news from the tangible deliverables. First, I know that many companies follow the conventional wisdom and wait for the first service pack before deploying a new product. Now the wait is over and I expect mass adoption of SQL Server 2012. At Prologika, we’ve been using SQL Server 2012 successfully since it was in beta and I wholeheartedly recommend it. Second, SP1 is a prerequisite for configuring BI in SharePoint 2013, as I explained previously. Indeed, I downloaded and run the setup and I was able to continue the SharePoint 2013 PowerPivot configuration. BTW, the build number of SP1 is 11.0.2100.60.

Note If you’re configuring PowerPivot for SharePoint 2013, you must also install a PowerPivot for SharePoint 2013 add-in (there is a new installer package called spPowerpivot.msi) in order to get the upgraded version of the PowerPivot Configuration Tool for SharePoint 2013. If you open the RTM version of the PowerPivot Configuration Tool for SharePoint, it will promptly complain that it doesn’t know a thing about SharePoint 2013 and redirect you to this page. Unfortunately, at this time, the link on this page points to the Community Technology Preview of the SQL Server 2012 SP1 Feature Pack and the whereabouts of the official SP1 release of the feature pack are not known (the Feature Pack was published with an incomplete list of files). I downloaded and ran the CTP version of and then ran the PowerPivot Configuration Tool for SharePoint 2013. It appears that the CTP version did a respectable job and all it was capable of successfully configuring PowerPivot for SharePoint. However, please wait for the official release of the SQL Server 2012 Feature Pack to avoid issues.

  1. Power View for Multidimensional – OK, the cat is out of the bag on this one and Amir showed a demo. As a participant of the CTP program Power View for Multidimensional, I’m very happy about it. That’s all I can say at this point while waiting for the public technology preview. Unfortunately, Power View for Multidimensional didn’t make it to SP1 and it’s not known at this point when and how it will ship. But if you have multidimensional cubes (and who doesn’t) the wait will be worthwhile I promise.
  2. Updatable Columnstore Indexes in SQL SERVER.NEXT – This a good news for users of columnstore indexes that will avoid dropping and recreating the indexes. This will be especially useful for columnstore indexes built on top of large fact tables, such as in the scenario I described here.
  3. Hekaton – Plans to ship a long-due in-memory OLTP technology in SQL Server.NEXT.
  4. Polybase – Another new technology slated for the next release of SQL Server 2012 Parallel Data Warehouse (expected in first half of 2013) that will allow you to run T-SQL queries joining relational data residing in PDW and Hadoop data. I guess this is the materialization of the David DeWitt’s Enterprise Data Manager idea that he talked about in his 2011 PASS presentation. I’m looking forward to his sequel which I suppose will go in details on this topic. Did we run out of cool names from the animal kingdom to succeed Hadoop, Mahoot, Pig, etc? I guess will find out in David’s talk.

Here is the list of the forthcoming live sessions.


UPDATE 11/8/2012

Here is a direct link to the release build of the PowerPivot Configuration Tool for SQL Server 2012 SP1.

Installing HDInsight Server for Windows

As you’ve probably heard the news, Microsoft rebranded their Big Data offerings as HDInsight that currently encompasses two key services:

  • Windows Azure HDInsight Service (formerly known as Hadoop-based Services on Windows Azure) – This is a cloud-based Hadoop distribution hosted on Windows Azure.
  • Microsoft HDInsight Server for Windows – A Windows-based Hadoop distribution that offers two main benefits for Big Data customers:
    • An officially supported Hadoop distribution on Windows server – Previously, you can set up Hadoop on Windows as an unsupported installation (via Cygwin) for development purposes. What this means for you is that you can now set up a Hadoop cluster on servers running Windows Server OS.
    • Extends the reach of the Hadoop ecosystem to .NET developers and allows them to write MapReduce jobs in .NET code, such as C#.

Both services are available as preview offerings and changes are expected as they evolve. The Installing the Developer Preview of Apache Hadoop-based services on Windows article covers the setup steps pretty well. I decided to set up HDInsight Server for Windows by installing the Microsoft Web Platform Installer on my Windows 8 laptop.

Note Initially, I planned to install HDInsight Server for Windows on a VM running Windows Server 2012 Standard Edition. Although the installer completed successfully, it failed to create the sites and shortcuts to the dashboards (Hadoop Name Node, Dashboard, and MapRaduce). This was probably caused by the fact that server was configured as a domain controller. There is an ongoing discussion about this issue on the Microsoft HDInsight forum.

The Windows 8 setup failed to create the shortcut to the dashboard. However, the following steps fixed the issue:

1. Open up an Administrator PowerShell prompt and elevate the execution policy of the PowerShell to accept scripts.

PS:> Set-ExecutionPolicy RemoteSigned

2. Navigate to the C:\HadoopFeaturePackSetup\HadoopFeaturePackSetupTools folder:

cd C:\HadoopFeaturePackSetup\HadoopFeaturePackSetupTools

  • Install HadoopWebApi

.\winpkg.ps1 ..\Packages\HadoopWebApi-winpkg.zip install -CredentialFilePath c:\Hadoop\Singlenodecreds.xml

  • Install the dashboard

.\winpkg.ps1 ..\Packages\HadoopDashboard-winpkg.zip install -CredentialFilePath c:\Hadoop\Singlenodecreds.xml

This should create the shortcuts on the desktop and you should be able to navigate to http://localhost:8085 to access the dashboard.

110112_0205_InstallingH1

From here, you can open the Interactive Console and your experience should be the same as Windows Azure HDInsight Service. David Zhang has a great coverage of how you can use the Interactive Console in his video presentation “Introduction to the Hadoop on Azure Interactive JavaScript Console”.

BTW, HDInsight Server installs a set of Windows services corresponding to the UNIX daemons when Hadoop is installed on UNIX.

110112_0205_InstallingH2

Hadoop and Big Data Tonight with Atlanta BI Group

Atlanta BI Group is meeting tonight. The Topic is Hadoop and Big Data by Ketan Dave and our sponsor is Enterprise Software Solutions.

With wide acceptance of open source technologies , Hadoop/Map Reduce has become a viable option when it comes implementing the 100 of Terabytes to Petabytes of Data solutions. Scalability, Reliability , Versatility and Cost benefits of Hadoop based system is replacing traditional approach of data solutions. Microsoft has partnered with Hadoop vendors, have recently made announcements to make data on Hadoop accessible by Excel, easily linked to SQL Server and its business intelligence, analytical and reporting tools for business intelligence and managed through Active Directory.

I hope you can make it!

SharePoint 2013 and SQL Server 2012

As I mentioned before, Microsoft released SharePoint 2013 and Office 2013 and the bits are now available on MSDN Subscriber Downloads. I am sure you are eager to try the new BI features. One thing that you need to be aware of though is that you need SQL Server 2012 Service Pack 1 in order to integrate the BI features (PowerPivot for SharePoint and SSRS) with SharePoint 2013. If you run the RTM version of SQL Server 2012 setup, you won’t get too far because it will fail the installation rule that SharePoint 2010 is required. That’s because the setup doesn’t know anything about SharePoint 2013 and the latest release includes major architectural changes.

Then the logical question is where is SQL Server 2012 SP1 now that is a prerequisite for SharePoint 2013 BI? As far as I know there isn’t a confirmed ship date yet but it should arrive soon. I’d suspect Microsoft to announce it at PASS.