Organizational BI vs. Personal BI

This is a blog post that I’ve been planning for a while. With the ever-increasing power of laptops and desktop computers and declining hardware prices, personal BI is on the rise. Typically, a new technology usually has a self-propelled upward spiral to a point – vendors are talking about it to clients, executives are talking about it on golf courses, consultancies are talking about it, and are rushing to fill in the void. There is a lot of money to be made with a lot of misinformation and sometimes outright lies. I’ll be quick to point out that personal BI alone is not going to fix your BI and data challenges. However, it can complement organizational BI well and open possibilities when organizational BI alone is not enough. You might find the following information interesting when you’re contemplating which way to go.

Organizational BI

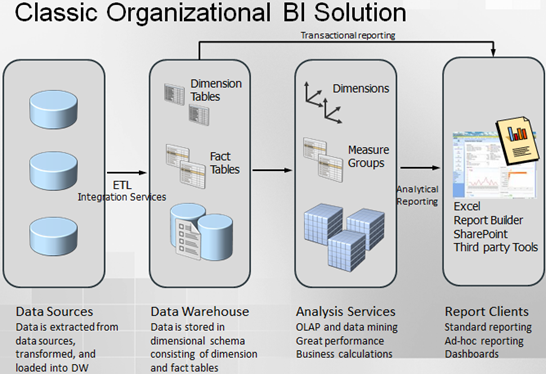
Organizational BI is a set of technologies and processes for implementing an end-to-end BI solution where the implementation effort is shifted to BI Pros. An example of a “classic” (and somewhat simplified) organizational BI solution follows.

052712_2221_Organizatio1

PROS

  • Pervasive business intelligence – Available to all users across the enterprise, subject to security policies.
  • Single version of the truth with trusted data – Provides accurate and trusted analysis and reporting. Data is clean, validated, and secure.
  • Rich feature set –OLAP, data mining, KPIs, dashboards. For more information about using Analysis Services for organizational BI, read my blog Why an Analytical Layer?
  • Performance – High performance and scalability with massive data volumes

CONS

  • Effort – Significant development effort might be required
  • Skills – Specialized skills required (BI pros)
  • More rigid – Less flexible to react to new business requirements


PERSONAL BI

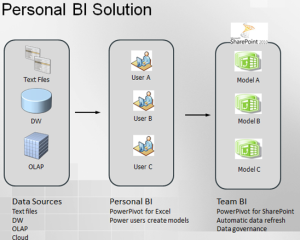
Personal BI provides business users tools for implementing ad-hoc BI models with help, guidance and supervision from IT (see below). In the Microsoft BI world, the tool for personal BI is PowerPivot with its two flavors: PowerPivot for Excel and PowerPivot for SharePoint.

052712_2221_Organizatio2

PROS

  • Offloads effort from IT – Anyone can implement BI models if they have access to data. However, IT must still provide ongoing guidance and supervision, such as to provide access to data, to implement more advanced business calculations, to monitor the shared environment where the BI models are deployed. Therefore, I believe more in “managed” personal BI than just personal BI.
  • Knowledge domain expertise – Business users should know their domain better than IT.
  • Data mashups — Easy to mix data from different data sources.
  • Data exploration – Let business users explore data and tell IT what they really want before BI pros take over.

CONS

  • “Spreadmarts” – Proliferation of models. Which model do you trust?
  • Data integrity and validation issues – If users don’t import data that is already validated, such as importing data stored in the company’s data warehouse, reports probably cannot be trusted.
  • Power users – In reality, personal BI requires power users. In my experience, regular users don’t have the desire, skills, and time to create models. A case in point – a major organization decided to embrace a popular tool for personal BI but hired a consultancy to implement the reports! Have you heard from your users that they want operational reports, preferably delivered to them via subscriptions?
  • Security issues – Another burden on IT to secure data and make sure that data is not compromised when the business user imports it and share the model with another user.

So, each approach has pros and cons. Instead of exclusivity, consider using them together. For example, implement organizational BI for pervasive BI and single version of the truth, coupled with isolated scenarios for personal BI, such as when the data is not in the data warehouse or when users need to mash up data.

Why an Analytical Layer?

I had a presentation on the BI Semantic Layer and Tabular modeling for the Atlanta BI Group on Monday. Midway during the presentation, a DBA asked why we need an analytical layer on top of data. I’m sure that those of you who are familiar with traditional reporting and haven’t discovered yet Analysis Services might have the same question so let’s clarify.

  1. Semantic layer

    In general, semantics relates to discovering the meaning of the message behind the words. In the context of data and BI, semantics represents the user’s perspective of data: how the end user views the data to derive knowledge from it. As a modeler, your job is to translate the machine-friendly database structures and terminology into a user-friendly semantic layer that describes the business problems to be solved. To address this need, you create a semantic layer. In the world of Microsoft BI, this is the Business Intelligence Semantic Model (BISM). The first chapter (you can download it from the book page) of my latest book “Applied Microsoft SQL Server 2012 Analysis Services (Tabular Modeling)” explains this in more details.

  2. Reducing reporting effort

    Suppose that your boss comes one day and tells you that IT spends too much effort on creating operational reports. Instead, he wants to minimize cost and empower the business users to create their own reports. One of the nice features of Analysis Services is that the entity relationships become a part of the model. So, end users don’t have to know how to relate the Product to Sales entities. They just select which fields they want on the report and the model knows how to relate and aggregate data.

  3. Performance

    Analysis Services is designed to provide excellent performance when aggregating massive amounts of data. For example, in a real-life project we are able to achieve delivering operational reports within milliseconds that require aggregating a billion rows. Try to do that with relational reporting, especially when you need more involved calculations, such as YTD, QTD, parallel period, etc. Having an analytical layer might save you millions of dollars to overcome performance limitations (to a point) with relational reporting by purchasing MPP systems.

  4. Single version of the truth

    The unfortunate reality that we’re facing quite often is that many important business metrics end up being defined and redefined either in complex SQL code or reports. This presents maintenance, implementation, and testing challenges. Instead, you can encapsulate metrics where they belong – in your analytical model. As an added bonus, you will be able to use an expression language (MDX or DAX) that is specifically designed for business calculations. Moreover, the modeler can define key performance indicators (KPIs).

  5. Additional BI possibilities

    This goes hand in hand with 2, but the point that I want to emphasize here is that many reporting tools are designed to integrate and support Analysis Services well. For example, Microsoft provides Excel on the desktop and the SharePoint-based Power View tool that allows business users to create their own reports. An analytical layer opens also additional possibilities, such as performance dashboards.

  6. Security

    How much time do you spend implementing custom security frameworks for authorizing users to access data they are allowed to see on reports? Moving to Analysis Services, you’ll find that the model can apply security on connect. I wrote more about this in my article Protect UDM with Dimension Data Security.

  7. Isolation

Because an analytical layer sits on top of the relational database, it provides a natural separation between reports and data. For example, assuming distributed deployment, a long-running ETL job in the database won’t impact the performance of the reports serviced by the analytical layer.

Presenting at Atlanta BI Group

I’ll be presenting “The Analysis Services 2012 Tabular Model” for the Atlanta BI Group on Monday, May 21st. And, Darren Herbold will share some great insights harvested from a real-life project of how to use SSIS to integrate with Salesforce.com. I hope you can make the event, which will be sponsored by Prologika.

“SQL Server 2012 introduces the BI Semantic Model that gives BI pros two paths for implementing analytical layers: Multidimensional and Tabular. The Tabular model builds upon the xVelocity engine that was introduced in PowerPivot. Although not as feature-rich as Multidimensional, Tabular promotes rapid professional development and great out-of-box performance. This session introduces you to Tabular development and shares lessons learned. I’ll also discuss how Tabular and Multidimensional compare.”

Analysis Services Processing and CXPACKET Waits

Performance tuning – my favorite! This blog originated from a quest to reduce the processing time of an SSAS cube which loads some 2.5 billion rows and includes DISCINTCT COUNT measure groups. The initial time to fully process the cube was about 50 minutes on a dedicated DELL PowerEdge R810 server, with 256 GB RAM and two physical processors (32 cores total). Both the SSAS and database servers were underutilizing the CPU resources with SSAS about 60-70 utilizations and the database server about 20-30 CPU utilization. What was the bottleneck?

By using the sys.dm_os_waiting_tasks DMV like the statement below (you can use also the SQL Server Activity Monitor), we saw a high number of CXPACKET wait types.

SELECT
dm_ws.wait_duration_ms,

dm_ws.wait_type,

dm_es.status,

dm_t.TEXT,

dm_qp.query_plan,

dm_ws.session_ID,

dm_es.cpu_time,

dm_es.memory_usage,

dm_es.logical_reads,

dm_es.total_elapsed_time,

dm_es.program_name,

DB_NAME(dm_r.database_id) DatabaseName,

— Optional columns

dm_ws.blocking_session_id,

dm_r.wait_resource,

dm_es.login_name,

dm_r.command,

dm_r.last_wait_type

FROM
sys.dm_os_waiting_tasks
dm_ws

INNER
JOIN
sys.dm_exec_requests
dm_r
ON
dm_ws.session_id = dm_r.session_id

INNER
JOIN
sys.dm_exec_sessions
dm_es
ON
dm_es.session_id = dm_r.session_id

CROSS
APPLY
sys.dm_exec_sql_text
(dm_r.sql_handle)
dm_t

CROSS
APPLY
sys.dm_exec_query_plan
(dm_r.plan_handle) dm_qp

WHERE
dm_es.is_user_process = 1

The typical advice given to address CXPACKET waits is to decrease the SQL parallelism by using the MAXDOP setting. This might help in some isolated scenarios, such as UPDATE or DELETE queries. However, the SQL Sentry Plan Explorer showed that each processing query is highly parallelized to utilize all cores. Notice in the screenshot below, that thread 16 fetches only 14,803 rows.

051512_0211_AnalysisSer1

Therefore, the CXPACKET waits were simply caused by faster threads waiting for other threads to finish. In other words, CXPACKET wait is just a coordination mechanism between the threads being parallelized. To confirm this, we set the SQL Server MAXDOP setting to 1. Surely, the CXPACKET waits disappeared but the overall cube processing time went up as well. In our case, the biggest benefit was realized not by decreasing the SQL Server parallelism but by increasing it, by increasing the maximum number of database connections. This resulted in decreasing the overall processing time some 20%.

051512_0211_AnalysisSer2

You need to be careful here though. While increasing the connections to max out the CPU on the SSAS server will yield the biggest gain, it might also slow down other processing, such as reports that query the cube while the database is being processed. So, as a rule of thumb, target no more than 80% CPU utilization to leave room for other tasks.