I’m excited to announce that Prologika is now a Microsoft Gold Business Intelligence Partner. This reconfirms our reputation as a premier BI consulting and training company in Atlanta. According to Microsoft, only top 5% of the Microsoft partners worldwide have Silver or Gold competency, and only 1% withGold competency. Kudos to all Prologika consultants on the team who helped us to achieve this major accomplishment!
https://prologika.com/wp-content/uploads/2016/01/logo.png00Prologika - Teo Lachevhttps://prologika.com/wp-content/uploads/2016/01/logo.pngPrologika - Teo Lachev2012-08-17 18:43:002016-02-16 06:38:19Prologika is Microsoft Gold Business Intelligence Partner
Microsoft published a case study “Records Management Firm Saves $1 Million, Gains Faster Data Access with Microsoft BI”. Prologika architected the data warehouse, OLAP cubes, and presentation layer consisting of operational reports, SharePoint management dashboard and Power View reports.
Recall, a records-management firm, needed faster access to key performance indicators and more intuitive business intelligence (BI) tools. The company consolidated four data centers into a Microsoft SQL Server 2012 data warehouse. The solution’s performance enhancements speed employee access to more detailed data. By consolidating into a data warehouse, the company saved U.S. $1 million in hardware and licensing costs…With help from Microsoft partners Prologika and Berg Information Technology, Recall started deployment in August 2011 and went into production in February 2012.
https://prologika.com/wp-content/uploads/2016/01/logo.png00Prologika - Teo Lachevhttps://prologika.com/wp-content/uploads/2016/01/logo.pngPrologika - Teo Lachev2012-08-16 17:49:022016-02-16 06:39:31Microsoft Case Study for Recall and Prologika
TAG BI is organizing a “Making Big Data Real” event on August 23th and I was honored to be one of the panelists. Please join us if you can and ask me the techniques we use to implement multi-terabyte data warehouses on symmetric multiprocessing (SMP) systems that deliver reports within milliseconds and maximize your return on investment.
“The Technology Association of Georgia’s Business Intelligence/Enterprise Performance Management society explores one of the hottest topics in the technology landscape, Big Data. You have likely read the articles and the books and now you need to know more. On August 23, we will bring together a panel of experts for a most important session: “Making Big Data Real”. Please join us as we engage corporate technology leaders and consultants that are on the cutting edge of this new technology landscape. We will tell you what Big Data is all about and how you can make it real and actionable at your workplace and in your career. This is surely a professional event you do not want to miss.”
https://prologika.com/wp-content/uploads/2016/01/logo.png00Prologika - Teo Lachevhttps://prologika.com/wp-content/uploads/2016/01/logo.pngPrologika - Teo Lachev2012-08-11 14:22:562016-02-16 06:40:09Making Big Data Real from TAG BI
I’d delegate this one to the PerformancePoint 2013 blog, where Kevin Donovan, Microsoft Program Manager, nicely addresses PerformancePoint speculation, confusion and misinformation while also introducing what is new in detail.
https://prologika.com/wp-content/uploads/2016/01/logo.png00Prologika - Teo Lachevhttps://prologika.com/wp-content/uploads/2016/01/logo.pngPrologika - Teo Lachev2012-08-10 00:29:222021-02-16 02:47:21What’s New in Office 2013 BI: Part 5 – New Features in PerformancePoint 2013
To demonstrate the new features with Excel web reports, I stood up an Office 365 Technical Preview site. If you have received Office 365 invitations already, make sure that you choose the one with the SKU E3. Otherwise, you’ll get access to the administrator portal only and you won’t see the SharePoint, Outlook, and other menus.
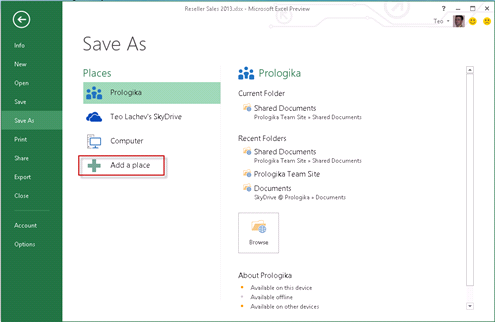
Assuming you use Office 2013, you’ll find that it integrated much better with the cloud. Gone is the Save and Send menu. Instead, saving to could destinations, such as SkyDrive and Office 365, can be now be initiated from the Save As menu by adding a new place.
As before, once the Excel workbook lands in the Office 365 SharePoint (or SharePoint 2013) land, it’s automatically available for web reporting. However, the most exciting new feature now is that the web reports are editable and end users can change the report layout with both PowerPivot and OLAP cubes as data sources! To do so, simply right-click any cell on the pivot report and click Show Field List. Just like the desktop version of Excel, you can now add or remove fields in the Field List to update the report.
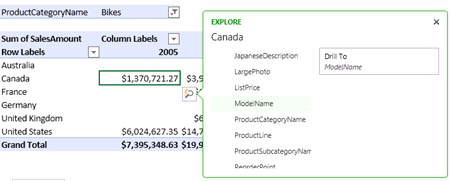
The Quick Explore feature is available as well to support a “Proclarity-like” data exploration experience. You can click a cell on the report and then click on the magnifying class icon and pops up. Or, right-click a cell and click Quick Explore. Then, expand a table (dimension) and select which field (attribute) you want to drill-down to.
Unfortunately, drillthrough is still unsupported and you can’t drill down a cell to see the underlying details as you can in Excel desktop. This feature is very frequently requested and I don’t know why it didn’t make the cut. Another feature that I would love to get with both Excel desktop and web reports is the Decomposition Tree that is currently only available with PerformancePoint Services. Speaking of PerformancePoint, SharePoint 2013 brings improved branding, filter enhancements and filter search, as well as support for Analysis Services EffectiveUser connecting string setting in case configuring Kerberos is not an option.
https://prologika.com/wp-content/uploads/2016/01/logo.png00Prologika - Teo Lachevhttps://prologika.com/wp-content/uploads/2016/01/logo.pngPrologika - Teo Lachev2012-08-06 13:37:002016-02-16 06:44:24What’s New in Office 2013 BI: Part 4 – New Features in Excel Web Reports