Microsoft released the Community Technology Preview 1 (CTP1) of SQL Server 2014. As I mentioned in my previous post, the accompanying Product Guide should get you started with the new features.
https://prologika.com/wp-content/uploads/2016/01/logo.png00Prologika - Teo Lachevhttps://prologika.com/wp-content/uploads/2016/01/logo.pngPrologika - Teo Lachev2013-06-26 12:20:162016-02-15 11:46:20Microsoft SQL Server 2014 Community Technology Preview 1 (CTP1) Released
In anticipation of SQL Server 2014 CTP1, which should be out soon, Microsoft released Microsoft SQL Server 2014 CTP1 Product Guide – a collection of white papers, slides, and other resources that discuss the new features to help you evaluate SQL Server 2014.
“The SQL Server 2014 CTP1 Product Guide is now officially available to customers and partners. The guide is intended to help you get the most value out of Microsoft SQL Server 2014 CTP1.”
https://prologika.com/wp-content/uploads/2016/01/logo.png00Prologika - Teo Lachevhttps://prologika.com/wp-content/uploads/2016/01/logo.pngPrologika - Teo Lachev2013-06-23 18:29:002016-02-15 11:47:40Microsoft SQL Server 2014 CTP1 Product Guide Released
The Atlanta Microsoft BI Group will have a meeting tomorrow, June 24th.
Main Presentation: Developing a Custom Task in SSIS 2012 Level: Intermediate
Date: June 24th Time 6:30 – 8:30 PM ET
Place: South Terraces Building (Auditorium Room) 115 Perimeter Center Place Atlanta, GA 30346
Overview: Integration Services uses tasks to perform units of work in support of the extraction, transformation, and loading of data. Integration Services includes a variety of tasks that perform the most frequently used actions, from executing an SQL statement to downloading a file from an FTP site. If the included tasks and supported actions do not completely meet your requirements, you can create a custom task. In this session we will demonstrate to you how to create custom SSIS tasks.
Speaker: Aneel Ismaily was born and raised in Karachi, Pakistan. He moved to the United States at the age of 18. Since then he has lived in Atlanta, GA. Aneel did his undergrad in Computer Science (BS) from Georgia State University (GSU) with concentration in Database Systems. He recently graduated with a professional MBA degree from Georgia State University with concentration in Organization Management and Entrepreneurship. Aneel owns MSBI Consulting, an IT consulting firm. MSBI Consulting provides Business Intelligence solutions to its customers. Prior to MSBI Consulting, Aneel was employed with Intellinet where he was working as a Principal Consultant. Before that he worked at RDA Corporation where he was working as a Sr. Software Engineer and before RDA he worked as a BI Solution Developer at BCD Travel. You can learn more about Aneel at http://www.linkedin.com/in/aismaily.
Sponsor: 3Sage Consulting Founded and led by real consultants who really care about the end deliverable, 3sage is untangling some of the most complex data issues in business today.
Prototypes with Pizza: Real-time BI with Big Data Demo by Teo Lachev
So, you have classic BI, self-service BI, Big Data BI, predictive BI, but do you have real-time BI? To demonstrate how classic BI, Big Data, and real-time BI can play together, Microsoft put together a great sample – Big Data Twitter Demo.
https://prologika.com/wp-content/uploads/2016/01/logo.png00Prologika - Teo Lachevhttps://prologika.com/wp-content/uploads/2016/01/logo.pngPrologika - Teo Lachev2013-06-23 17:38:002016-02-15 11:49:59Atlanta BI Group Meeting on Monday
So, you have (or heard of) classic BI, self-service BI, Big Data BI, descriptive BI, predictive BI or even prescriptive BI, but do you have real-time BI? I’ve been doing quite bit of research and work in that area lately. As you could imagine, real-time BI requires a different architecture that is capable of processing streams of data (sometimes thousands of events) in real time. The Microsoft premium technology for Complex Event Processing (CEP) is StreamInsight (requires a SQL Server license). Microsoft has also a lightweight, open-source .NET library called RX which does event streaming but it doesn’t have many of the StreamInsight features, such as windowing. To demonstrate how classic BI, Big Data, and real-time BI can play together, Microsoft put together a great sample – Big Data Twitter Demo.
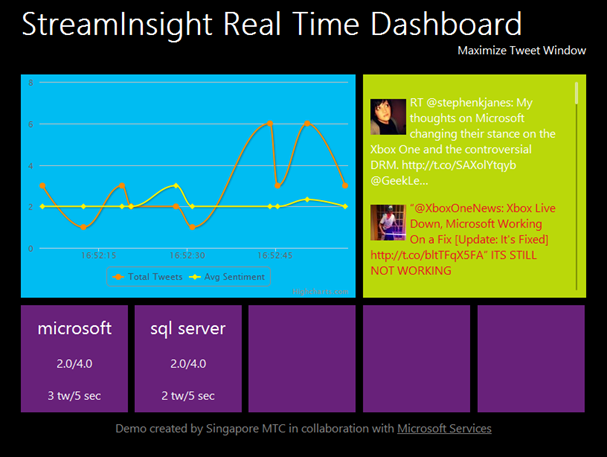
The demo allows you to subscribe to one or more Twitter topics of interest. It uses StreamInsight to listen to the Twitter activity and extract tweets that match the topics you “subscribe” to. In the screenshot below, I’m intercepting tweets about Microsoft and SQL Server. Then the demo saves the results to a SQL server table for offline analysis with PowerPivot and Power View (a sample Excel workbook with reports is included). In addition, the demo stores the results in a SQL Azure Hadoop cluster (HDInsight). I guess the idea is to truncate the operational SQL Server store on a regular basis while archiving all data on Hadoop for future analysis. The demo also includes a dashboard that displays the matching tweets and hit rate in real time. Behind the scenes, the application uses Web Sockets (IMO, SignalR would have been a better choice here since Web Sockets have limited browser and platform support) to communicate with the JQuery code on the client which updates the dashboard content. For more information about how all of this work, Mike Wilmot covers the demo in more details.
This is a very impressive demo and I can imagine how much effort went into building it. I personally believe that we’ll see more demand for real-time applications, especially coupled with predictive analytics, such as detecting outliers or forecasting volumes.On the downside, a few days after Microsoft released the demo, Twitter discontinued Basic Authentication, which the demo uses to authenticate with Twitter (you need a Twitter account to run it). Twitter now uses OAuth so I had to tweak the code. Specifically, I added the OAuthTokens.cs and WebRequestBuilder.cs from the Patrick Smith’s Twitterizer library to the StreamInsight.Demos.Twitter.Common class library in the demo. In the same library, I changed the Read method in the TwitterStreaming class as follows:
publicTextReader Read() {
var url = GetURL();
// Basic Authencation – Obsolete
//var request = HttpWebRequest.Create(url);
//request.Timeout = _config.Timeout;
//request.Credentials = new NetworkCredential(_config.Username, _config.Password);
//var response = request.GetResponse();
// Twitter uses OAuth now which is much more complex to implement so you need wrapper classes, such as Twitterizer
And, to get the dashboard to work, I had to use Safari since for some obscure reason Web Sockets won’t work for me with IE 10 on Windows 8. If I have time, I plan to cover StreamInsight and real-time BI in more details in future posts.
Issue: A customer reports an issue with a production SSAS Tabular instance not starting after reboot. The server has also an SSAS Multidimensional instance which starts just fine. There are no interesting messages in the Event Viewer.
Resolution: During installation, the customer has configured the LogDir of both instances to point to the same physical folder. However, the Flight Recorder can’t start on the Tabular instance because the log file is already locked by the Multidimensional instance. The solution to this horrible problem was to reconfigure the LogDir setting of the Tabular instance (in SSMS, connect to the SSAS instance, right-click the server, and click Properties) to a separate folder.
Moral: Always separate DataDir, LogDir and TempDir folders so each instance has its own set of folders.
Using “smart” date surrogate integer keys in the format YYYYMMDD is a dimensional modeling best practice and venerable design technique. To make them smarter though, consider using the Date data type which was introduced in SQL Server 2008. The Date data type stores the date without the time component which is exactly what you need anyway. Using the Date data type instead of integers have the following benefits:
The Date data type allows you to perform date arithmetic easier as the date semantics is preserved, so you can use date functions, such as YEAR and MONTH when querying the table or partitioning a cube.
Self-service BI users can conveniently filter dates on import. For example, PowerPivot enables relative date filtering, such as Last Month, when the user filters a date column.
The Date data type has a storage of three bytes as opposed to four bytes for integers.
The only small downside of using the Date data type is that you will end up with funny looking unique names for the Date members in your Date dimension in an SSAS cube. The unique name will include the time portion, such as [Date].[Date].&[2013-07-01T00:00:00]. If you construct date members dynamically, e.g. to default to the current date, you have to append the time portion or use the Format function, such as Format(Now(),”yyyy-MM-ddT00:00:00″).
The short answer is nothing much, which is probably good so we can catch our breath after the SQL Server 2012 and Office 2013 waves. As you’ve probably heard, Microsoft announced SQL Server 2014 at TechEd. SQL Server 2014 will be a database-focused release with no major changes to the BI “pillars” (SSAS, SSRS, SSIS) and PowerPivot, except perhaps bug fixes. However, you might find some other new additions and enhancements interesting depending on your specific projects:
In-Memory Enhancements
This should come to no surprise due to the continuing investment in memory backed-up storage.
New In-Memory storage – Code-named Hekaton, this new in-memory storage option will allow you to host SQL Server tables in memory in order to improve I/O. While predominantly targeting OLTP applications, I believe Hekaton will be useful for narrow-case BI scenarios as well, such as for improving the performance of the ETL processes by using in-memory staging tables.
Enhanced Columnstore indexes – Columnstore indexes will be updatable so you don’t have to drop and recreate the index when you need to change data. For more information about how we used Columnstore indexes to speed up ETL, read this blog.
Big Data
There is a lot of talk about big data around the following two technologies:
Hadoop – As I’ve covered before, Microsoft marketing term for Hadoop-based distributions is HDInsight. I also showed you how to program MapReduce jobs so I won’t repeat myself here.
Polybase – The latest version of Microsoft Parallel Data Warehouse (PDW) get extended to support querying Hadoop-based data via a technology called Polybase. Microsoft’s David Dewitt did a great coverage of Polybase at SQL Pass 2012.
For more coverage of the new features, read the SQL Server 2014: A Closer Look blog by the Microsoft SQL Server team. Toward the end, notice that the public CTP1 will be out in a few weeks.
https://prologika.com/wp-content/uploads/2016/01/logo.png00Prologika - Teo Lachevhttps://prologika.com/wp-content/uploads/2016/01/logo.pngPrologika - Teo Lachev2013-06-05 17:39:002021-02-16 04:29:11What’s New for BI in SQL Server 2014?
As I mentioned in my previous blog, CU4 for SQL Server 2012 SP1 includes the release bits of Power View Connectivity for Multidimensional (DAXMD). It allows you to create Power View reports from Multidimensional cubes. In this blog, I’ll show you how to configure this feature.
APPLYING CU4
You need to upgrade both Reporting Services in SharePoint mode and the Analysis Services instance that hosts your cubes. If SharePoint and SSAS are on the same machine, as in the screenshot below, you need to run the CU4 setup program only once. In this case, I decided to accept the default choice and upgrade all instances on the box although the required ones are highlighted. With distributed deployments, you need to install CU4 on the SharePoint server and on the SSAS server.
CREATING DATA SOURCE
Once CU4 is applied, you’re ready to set up a data connection in a SharePoint library with SSRS integrated and SSRS document types enabled. You need a Report Data Source connection type. You cannot use BI Semantic Model Connection because you’ll need to specify which cube or perspective you are connecting and the BI Semantic Model Connection UI doesn’t have this option.
Once you open the Data Source dialog box, choose the Microsoft BI Semantic Model for Power View data source type. Specify the connection string as usual. Notice that the Cube setting is mandatory and it can specify a perspective. Depending on your security setup, you can enable Windows Authentication (requires Kerberos for double-hop) or stored credentials.
Once the connection is created, you can just click it to launch Power View connected to the cube or perspective. Microsoft did an excellent job to bend Power View to support Multidimensional concepts. The following features are supported:
As with Excel, measure groups appears on the top of the Field List and are prefixed with the sigma sign.
KPIs are supported but there isn’t a separate KPI folder (as in Excel for example). Instead, KPIs are found within the corresponding Measure Group they are mapped to during design.
Calculated members appear in corresponding measure group (table).
Cell errors are exposed as strings.
Cell properties are supported.
Both static and dynamic (e.g. scope assignments) format strings are supported.
Display folders are supported.
Hierarchies have a special icon but you can’t drag the entire hierarchy to the report. Instead, you need to select the levels you need. Parent-child hierarchies are supported but are flattened and the Field List shows all levels so the user can choose which level they want to see on the report.
Dimension attributes are mapped as table columns. Certain attribute types provide enhanced visualizations. For example, if an attribute is tagged as a City type, Power View shows a Map icon to inform the user that it can be used for geospatial reporting. In addition, Image->ImageUrl type has been added to SSDT to allow visualizing images from URL.
All relationship types are supported, including M:M and Referenced.
Perspective and translations are supported via connection string settings.
Dimension data security is supported.
DAX now supports Variant measures. A variant measure is a measure whose data type is not known until runtime, e.g. a measure whose data type is Currency but could be overwritten in a scope assignment as “NA”.
The following features are not supported:
Named Sets
Actions since Power View doesn’t support actions
Cell Security is not supported. Users belonging to a role with cell security restrictions to a cube cannot connect via Power View.
For more information about the level of support with excellent screenshots, read the Power View for Multidimensional Models – Feature Drill Down blog by Siva Harinath.
https://prologika.com/wp-content/uploads/2016/01/logo.png00Prologika - Teo Lachevhttps://prologika.com/wp-content/uploads/2016/01/logo.pngPrologika - Teo Lachev2013-06-02 20:30:002021-02-16 04:29:09Configuring Power View Connectivity to Multidimensional
Microsoft released Cumulative Update 4 for SQL Server 2012 Service Pack 1. This is more than a regular cumulative update as it includes enhancements to both Power View and Analysis Services to support connecting Power View to OLAP cubes, also known as DAXMD. For more information, read the official announcement by the Analysis Services product group. Now, business users can easily author ad-hoc reports and interactive dashboards by leveraging your OLAP investment. As a proud contributor to the DAXMD TAP program, I’d delighted with the results as I discussed in my blog “DAXMD Goes Public”.
I hate to dampen the spirit but be aware that only the SharePoint version of Power View has been extended to support Multidimensional. We don’t know yet when the same will happen to Power View in Excel 2013. Anyway, this is a very important BI enhancement and it’s time to plan your DAXMD testing and deployment.
https://prologika.com/wp-content/uploads/2016/01/logo.png00Prologika - Teo Lachevhttps://prologika.com/wp-content/uploads/2016/01/logo.pngPrologika - Teo Lachev2013-06-01 00:14:002021-02-16 02:47:06Power View Connectivity to Multidimensional (DAXMD) Released