“So, you have (or heard of) classic BI, self-service BI, Big Data BI, descriptive, predictive or even prescriptive BI, but do you have real-time BI? Real-time business intelligence (BI) has become one of the top priorities for data analytics. The ability of having near real-time access to large amounts of data across heterogeneous data sources is one of the key factors to enable effective business decisions. Join this talk to learn how to implement real-time analytics over streams of events using StreamInsight and .NET. You’ll see how these technologies come together in a Big Data Twitter demo that allows you to analyze the Twitter stream in real time.”
https://prologika.com/wp-content/uploads/2016/01/logo.png00Prologika - Teo Lachevhttps://prologika.com/wp-content/uploads/2016/01/logo.pngPrologika - Teo Lachev2013-07-21 18:33:542016-02-15 11:33:29Speaking at Atlanta Code Camp
Off the BI path but I wanted to save this tip for future generation and my sake in case I forget and I run into the same issue in Windows.NEXT or a new laptop. My $3,500 HP 3-year old EliteBook 8540w is prone to overheating. If a task puts a sustained pressure on the CPU, e.g. 10% or more, the fan engages and produces a noise like a howling wind in winter. It’s not so bad but it’s good enough to destroy my faith in HP… and embarrass me during meetings. The bottom of the laptop gets hot to a point where it can’t be used a laptop anymore. Eight months after I bought the laptop it became so bad that it would shut down from overheating so HP had to replace its motherboard and heat sink. And, now that the 3-year warranty expired it’s getting worse again.
Anyway, what got me curious is what causes CPU activity when the laptop is idle so I could minimize the level of its noise and embarrassment. I open the Windows 8 resource monitor (resmon.exe) and Task Manager side by side. I’ve noticed the problem gets worse when Office 2013 is running. This causes the Windows Search Index (SearchIndexer.exe) and SearchProtocolHost.exe to spring in the background, drawing more and more CPU time over time. I ran across a tip on the Internet that this happens if the Outlooks folders are above 2 GB in size. True, one of the Outlook archive folders and my main folder were above 2 GB so I had to do some pruning.
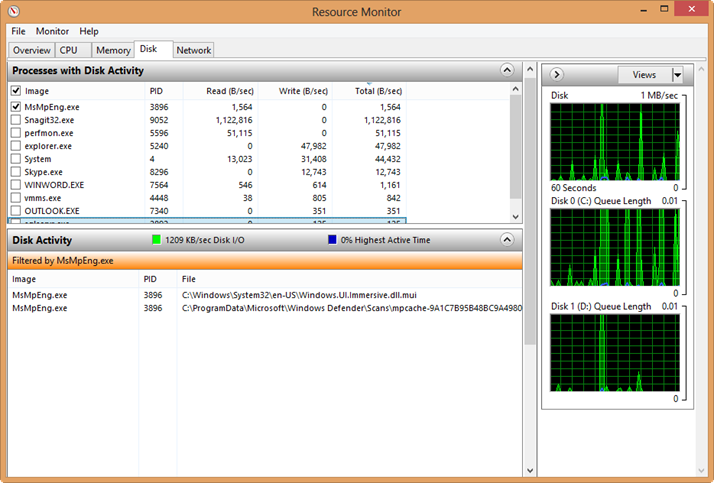
Another thing I’ve noticed is that the Antilmalware Service Executable (MsMpEng.exe), aka Windows Defender, will poke his head every now and then and draw some CPU cycles contributing to the CPU overhead. The Resource Monitor would show that the Antilmalware Service Executable would scan C:\Temp\fslogvw (the screenshot is meant to show how you can check what files a process accesses).
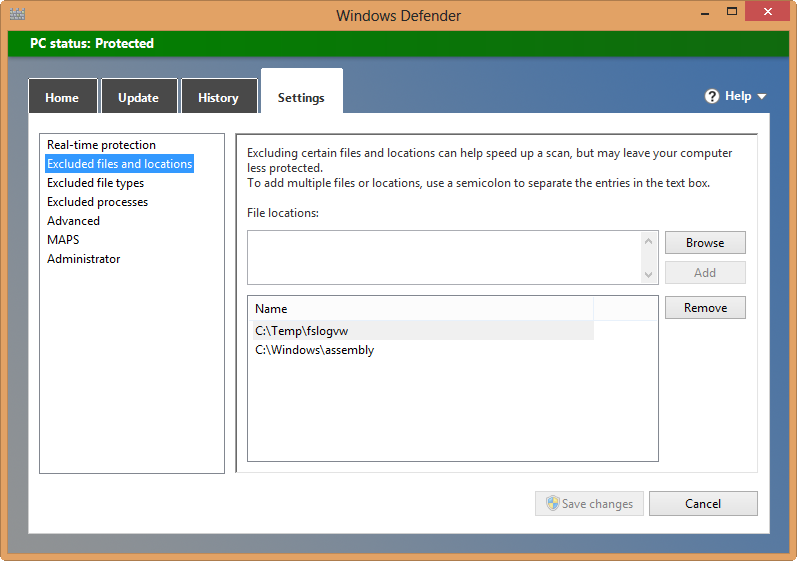
When this happens, the Task Manager would show mscorsvw.exe surging in CPU utilization. Mscorsvw.exe is precompiling .NET assemblies in the background, e.g. after a Windows update, so this is normal. When this happens, it generates .NET native images in C:\Temp\fslogvw so I had to exclude this folder and c:\windows\assembly from the Microsoft Defender real-time protection.
I left the Search Indexer to scan the new Outlook folders. When it was done it appeared that the CPU utilization is back to normal when the laptop was idle. One more tip. Disassemble the laptop and remove the fan cover as explained in the HP Maintenance and Service Guide. Then, clean the dust in the fan socket. In my case, there wasn’t much dust but you should probably start with cleaning if you run into overheating issues.
Expanding its Office 365 feature set, Microsoft introduced Power BI. Power BI is an umbrella name of the following BI offerings in the cloud: Power Pivot, PowerView, Power Query (previously known as Data Explorer), and Power Map (previously known as GeoFlow), plus more. Microsoft demonstrated Power BI at WPC yesterday (scroll to the 30th minute marker to see the Amir’s heart attack-provoking demo) or see the YouTube extract.
The “more” is the intriguing part to me:
Data Management Gateway – not sure how exactly this will work but it will provide some sort of connectivity to on-premise data so you can schedule PowerPivot data refreshes between the Microsoft cloud and your corporate data. Expect your ISP speed provider speed to be a limiting factor here so don’t hope for fast refreshes of millions of rows.
BI Sites – a dedicated SharePoint site that will support finding and collaborating on BI artifacts.
Mobile support – Power View is going HTML5!
Natural language query – Amir covered this interesting feature pretty well. I don’t know how it works behind the scenes yet (probably a natural language-to-DAX translator).
Data views – data stewards can publish datasets so they can be easily discoverable by Power Query.
King of the Hill – an interesting new PowerView visualization (demonstrated by Amir toward the end of the demo).
We don’t know at this point when these features will make to on-premise SharePoint, which probably would have been a better starting point for these enhancements. And, pricing hasn’t been announced yet. Look for Power BI toward the end of the summer if cloud self-service BI makes sense to your organization.
https://prologika.com/wp-content/uploads/2016/01/logo.png00Prologika - Teo Lachevhttps://prologika.com/wp-content/uploads/2016/01/logo.pngPrologika - Teo Lachev2013-07-09 23:28:002021-02-16 04:29:13Power BI Expands Microsoft Cloud Self-service BI
Issue: A client reports an issue with our PerformancePoint dashboard where the clicking a KPI in the scorecard doesn’t show the supporting analytical grid. Normally, when the user clicks a row in the Operational Scorecard (see the image below), the SharePoint connectable architecture triggers an update of the Operational Detail Report Months analytical report that shows more details about the selected KPI.
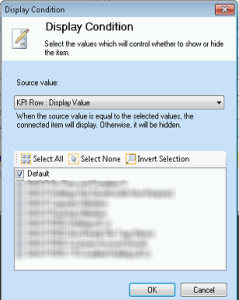
Workaround: Finding the cause was tricky. To make things even trickier, the SQL Server Profiler would show “Query (1, 36) Parser: The syntax for ‘,’ is incorrect.” error so you would believe that there is something wrong with the MDX queries. This turned out to be an “innocent” error if there is such a thing. The reason for the issue with the report refresh not working was actually a PerformancePoint Display Condition bug presumably introduced by a recent SharePoint upgrade (more than likely the April CU). The display condition actually works if you put the page in Edit mode. While waiting for a fix from Microsoft, the workaround I found is to enable a default display condition:
Open the dashboard in the Dashboard Designer.
In the Analytical Report web part, right-click the Display Condition and then Edit Condition.
Check the Default checkbox and redeploy the dashboard.
This displays the default configuration of the Analytical Grid report which the user will see when opening the dashboard page. For some reason, this makes the KPI row clicks work. Sometimes, things get worse before getting better…
https://prologika.com/wp-content/uploads/2016/01/logo.png00Prologika - Teo Lachevhttps://prologika.com/wp-content/uploads/2016/01/logo.pngPrologika - Teo Lachev2013-07-03 12:54:002016-02-15 11:42:04PerformancePoint Display Condition Not Working