So many names! Data warehouse, data mart, star-schema, snowflake schema, dimensional model, Type 1, Type 2, Type 3… What does it all mean? Whether you’re a data consumer, ETL specialist, or database designer, it pays to understand the vocabulary and design concepts of dimensional models. In this session, we’ll cover the basics of dimensional modeling, including dimensions, facts, and the ways they all come together. We’ll talk about why denormalization isn’t necessarily a dirty word, some common design challenges, and a few ETL considerations. By the end of the hour, you’ll be ready to impress your friends and confound your frenemies with your mad dimensional modeling knowledge!
Speaker:
Audrey Hammonds
Audrey Hammonds is working as a consultant for Innovative Architects in Atlanta. (With my fellow Datachix!) Fourteen years ago, she volunteered for DBA training to escape COBOL, and never looked back. A firm believer that good fundamentals and solid design can save a database professional’s sanity, she has devoted much of her career to designing (hopefully) elegant databases and straightening up others’ not-so-elegant databases. Audrey has run the gamut from Database Developer to Production DBA to Architect.
Prototypes with Pizza:
Power BI Natural Query by Teo Lachev
Sponsor:
Datachix Audrey Hammonds and Julie Smith
https://prologika.com/wp-content/uploads/2016/01/logo.png00Prologika - Teo Lachevhttps://prologika.com/wp-content/uploads/2016/01/logo.pngPrologika - Teo Lachev2013-09-30 11:45:002016-02-15 10:35:51Atlanta BI Group Meeting Tonight
I’ve upgraded to Windows 8.1 and got IE 11. As I’ve come to expect, a new browser upgrade brings a new set of issues, among which buttons disabled when they shouldn’t be and page posts not working. What about reports? This is what I get when I use Report Manager. The report toolbar is all messed up.
How to fix this horrible issue? Use the compatibility view of course:
Open Internet Explorer, press the Alt key, click Tools on the menu bar, and then click Compatibility View settings.
Add the report site, such as localhost, to the list of websites.
My Fall newsletter entitled “Why a Semantic Layer?” is out and it will be e-mailed to subscribers on Monday. The reason why I wrote is to bring the focus back on organizational BI. Based on my experience, decision are makers are confused about what their company’s BI strategy and roadmap should be. I’ve asked a BI manager recently if he knows that a semantic layer could be a true self-service BI enabler and he said he didn’t know. After talking to some well-known BI vendors and listening to their “pure” self-service mantra, the focus was shifted from a comprehensive BI architecture that truly addresses the company needs to selecting a tool that has the most visualization fluff.
In general, there are two self-service BI paths your organization can take:
Semantic layer + ad hoc reporting – If your organization decides to invest in implementing a comprehensive organizational BI framework (see the diagram in my newsletter) that features a semantic layer, the end user’s focus will be where it should be: on data analysis and not on building models. For example, end users can use Excel, Power View, or whatever third-party data visualization tool your company felt in love with, to connect to the semantic layer and create insightful ad hoc reports with a few clicks. No need to import data and build models before the business users ever get to data analysis.
Self-service models – In this scenario, you put the responsibility on end users to create models and their version of the truth. Following this path, an end user would use a tool, such as Power Pivot, to import data, create a model on the desktop, and then derive insights from the data. Don’t get me wrong. There are good reasons when this path makes sense, including the ones I mentioned in my blog “Does Self-service Make Sense”.
Ideally, your BI roadmap should consider and plan for both paths although the focus should be on organizational BI first and then finding gaps that self-service BI could address, such as testing ideas requiring external data. If your organization relies only on “pure” self-service BI, it won’t be long before you’ll find out that the pendulum has swung the wrong way. Many have taken this road but the outcome is always the same: “spreadmarts” that might get the work done in the interim but would fail in a long run. As a rule of thumb, I recommend the 80/20 principle, where 80% of the effort is spent on organizational BI (DW, ETL, semantic layer, dashboards, operational reports, data mining, big data, etc.) and 20% is left for self-service BI. But each organization is different so the ratio might vary.
Let me know your thoughts.
https://prologika.com/wp-content/uploads/2016/01/logo.png00Prologika - Teo Lachevhttps://prologika.com/wp-content/uploads/2016/01/logo.pngPrologika - Teo Lachev2013-09-21 23:51:002016-02-15 10:45:03Flavors of Self-service BI
Data is your biggest asset and today’s currency but the data can be messy. You know it and we’ve seen it – many times. The messier the data, the bigger the headache. At Prologika, we believe that data quality issues should be addressed as early as possible and the validation process should start with the source systems. You need a solution to detect data entry issues without ETL, custom validation code, and exhaustively hard-coded rules. This is why I’m excited to announce today the availability of Prologika Validator!
Available as a cloud service and on-premises offering, Prologika Validator uses predictive analytics to find data anomalies in order to help you improve data quality. It analyzes historical data and discovers common data patterns and relationships. When the user attempts to save a data entry that is outside the norm, Prologika Validator can detect the outlier. Then, the source system can notify the operator about a potential data entry error. As a result, the data is cleaned at the source and wrong data doesn’t end up in downstream systems, such as a data warehouse. Suppose your company buys some products from vendors. The operator responsible for the order entry creates an order in the ERP system, such as Oracle Financials or Microsoft Dynamics. The system might not be capable of detecting a wrong field entry or a wrong combination of fields, such as the user has specified a wrong unit of measurement for the product purchased. However, Prologika Validator is capable of detecting such outliers by predicting the likelihood that the order entry is outside the norm. The validation process is very fast and the operator is notified immediately.
Sounds interesting? Visit the Prologika Validator page and give it a try now. If you want to know how Prologika Validator can help you improve data quality, contact us to discuss your requirements and get a pricing proposal.
With the rising popularity of Power View, you may need to integrate it with PerformancePoint to jazz up your dashboards and make them more interactive. Take a look at the following, admittedly unpolished, dashboard which combines a PerformancePoint scorecard and Power View report.
What’s interesting is that the Power View report is synchronized with the dashboard filter. For example, when the user changes the filter to 2009, the Power View report filters on the same year. Starting with SQL Server 2012 SP1 CU4, Power View supports passing URL parameters using the syntax rf=[Table].[Field] eq Value. In this case I use the following Power View URL:
http://<site>/_layouts/15/ReportServer/AdHocReportDesigner.aspx?RelativeReportUrl=/PowerPivot Gallery/Adventure Works Dashboard.rdlx&ViewMode=Presentation&PreviewMode=True&PreviewBar=False&[Date].[Calendar Year] eq 2009
As you would quickly discover, the Power View customization is rather basic. The only operator supported for now is the equal operator (eq) and multi-valued parameters are not supported. The PerformancePoint integration is achieved by using the Web Page report type. Because of the mechanics of how PerformancePoint passes a parameter to a web page report (it always appends the Endpoint_Url query string containing the filter value), you’ll need a wrapper ASP.NET or HTML page that extracts this parameter and constructs the correct Power View URL. I opted for an ASP.NET page. Due to the SharePoint limitation that ASP.NET pages cannot have code-behind files, the PowerViewWrapper.aspx page, which I added to the Pages folder, includes the server side code:
<!DOCTYPE html PUBLIC “-//W3C//DTD XHTML 1.0 Strict//EN” “http://www.w3.org/TR/xhtml1/DTD/xhtml1-strict.dtd”>
Note: By default, SharePoint disallows custom code and the page will error out with “Code blocks are not allowed in this file”. To fix, this open C:\inetpub\wwwroot\wss\VirtualDirectories\80\web.config and change the PageParserPaths section as follows (allowing all pages with /* was the only way I was able to get the page to execute successfully:
The last part is to hook the Web Page report to the dashboard (no surprises here):
In the PerformancePoint Designer, add a Web Page report with an URL pointing to the wrapper page, such as http://<site>/bi/Pages/PowerViewWrapper.aspx?Dummy=1 (the Dummy parameter was added so ParseQueryString could parse the query parameter in the wrapper page).
Add the report to the dashboard.
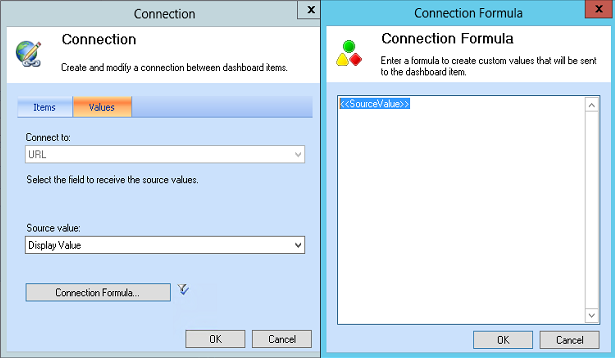
Drag the Display Value property of the filter and drop it onto the Web Page report zone.
In the Connection dialog box, click the Connection Formula button and configure it as follows:
The <<SourceValue>> placeholder returns the filter value, which PerformancePoint passes to the wrapper page, which in turn calls the Power View report.
https://prologika.com/wp-content/uploads/2016/01/logo.png00Prologika - Teo Lachevhttps://prologika.com/wp-content/uploads/2016/01/logo.pngPrologika - Teo Lachev2013-09-15 01:45:002016-02-15 10:55:44Integrating Power View with PerformancePoint
In my previous blog on the Power BI subject, I’ve introduced you to Power BI. In this blog, we’ll take a look at the Data Management Gateway and how to set up data sources to refresh on-premise data. I’ll be quick to point out that the actual data refresh is not in the preview yet.
The Data Management Gateway is implemented as a Windows service which you can download and install on premises. It has two main features:
Enable cloud access for on-premises data sources within your organization
Expose data from on-premises data sources as OData feeds that can be consumed by using Power Query.
You configure the gateway and data sources from the Admin->Power BI section of the Office 365 portal. This starts a simple wizard that walks you through the steps to install, configure, and test the data management gateway. You can set up multiple gateways if needed, such as to bring data from two geographically separated servers.
Once the gateway is installed, you can configure one or more data sources that point to on-premise data, such as a relational database. In the Power BI context, a data source corresponds to a data connection, similar to the ones you set up in Power Pivot. In the configuration process, you specify a data source name, the gateway it’s associated to, and connectivity details. For now, the only connectivity option is to connect to SQL Server but Microsoft is extending the connectivity options with the goal to support all data sources that Power Pivot supports.
The Data Source Usage tab allows you to configure how the data source will be used. If the Enable Cloud Access option is checked, users can refresh Power Pivot workbooks with on-premise data. If Enable OData Feed is checked, the data source will be exposed as an OData feed in Power Query. Thus, the gateway functionality that allows you to expose SQL tables/views as OData endpoints could be used in non-Power BI ways. For example, you could access the OData feed from an Azure service (provided that your service/code supports Org ID authentication).For more information about the latter option is useful and how it can be used when available in the self-service/team BI context, read Access OData Feeds from Power Query Add-in for Excel.
A few more notes:
Currently, The Data Management Gateway is specific to Power BI. You can’t use it to upload data to the cloud for other purposes, such as a replacement for FTP. However, I won’t be surprised if Microsoft would eventually turn it into an Azure platform service.
As far as performance, assuming there are no bottlenecks on the data access side (i.e. running complex queries), in most cases the gateway performance will be a factor of your Internet speed between your corporate network and the Azure data center. To improve performance, the gateway compresses, chunks, and parallelizes the upload of the data. Microsoft will provide more details of how it all works at the PASS Summit (Power BI and the Data Management Gateway session).
For more information about the Power BI data management experience, read Data Management Experience in Power BI for Office 365 Help.
https://prologika.com/wp-content/uploads/2016/01/logo.png00Prologika - Teo Lachevhttps://prologika.com/wp-content/uploads/2016/01/logo.pngPrologika - Teo Lachev2013-09-10 12:50:002021-02-17 01:02:06Power BI (Part 2 – The Data Management Gateway)
I’ve been doing some work with ASP.NET Web API and I’m setting a demo service in the cloud (more on this in a future post). The service could be potentially accessed by any user. For demo purposes, I wanted to show how jQuery script in a web page can invoke the service. Of course, this requires a cross-domain Javascript call. If you have experience with web services programming, you might recall that a few years ago this scenario was notoriously difficult to implement because the browsers would just drop the call. However, with the recent interest in cloud deployments, things are getting much easier although traps await you.
I settled on ASP.NET Web API because of its invocation simplicity and gaining popularity. If you are new to Web API, check the Your First Web API tutorial. To execute safely, Javascript cross-domain calls need to adhere to the Cross-origin resource sharing (CORS) mechanism. To update your Web API service to support CORS, you need to update your ASP.NET MVC 4 project as described here. This involves installing the Microsoft ASP.NET Cross-origin Support package (currently in a prerelease state) and its dependencies. You need also the latest version of System.Web.Helpers, System.Web.MVC, and other packages. Once all dependencies are updated, add the following line to the end of the Register method of WebApiConfig.cs
After testing locally, I’ve deployed the service to a Virtual Machine running on Azure (no surprises here). For the client, I changed the index.cshtml view to use jQuery to make the call via HTTP POST. I decided on POST because I didn’t want to deal with JSONP complexity and because the payload of the complex object I’m passing might exceed 1,024 bytes. The most important code section in the client-side script is:
var DTO = JSON.stringify(payload);
jQuery.support.cors = true;
$.ajax({
url: ‘http://<server URL>’, //calling Web API controller
cache: false,
crossDomain: true,
type: ‘POST’,
contentType: ‘application/json; charset=utf-8’,
data: DTO,
dataType: “json”,
success: function (payload) {…}
.fail(function (xhr, textStatus, err) {..}
Now, this is where you might have some fun. As it turned out, Chrome would execute the call successfully right off the bat. On the other hand, IE 10 barked with Access Denied. This predicament and the ensuing research threw me in a wrong direction and let me to believe that IE doesn’t support CORS and I had to use a script, such as jQuery.XDomainRequest.js, as a workaround. As a result, the call would now go out to the server but the server would return “415 Unsupported Media Type”. Many more hours lost in research…(Fiddler does wonders here). The reason was that the script delegates the call to the XDomainRequest object which doesn’t support custom request headers. Consequently, the POST request won’t include the Content-Type: ‘application/json’ header and the server drops the call because it can’t find a formatter to deserialize the payload.
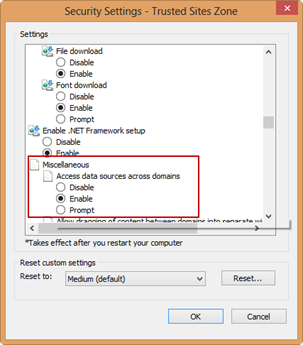
As it turns out, you don’t need scripts. The reason why IE drops the call with Access Denied is because its default security settings disallow cross-domain calls. To change this:
Add the service URL to the Trusted Sites in IE. This is not needed but it’s a good idea anyway.
Open IE Internet Options and select the Security tab. Then, select Trusted Sites and click the Custom Level button.
In the Security Settings dialog box, scroll down to the Miscellaneous section and set “Access data sources across domains”. Restart your computer.
Apparently, Microsoft learned their lesson from all the security exploits and decided to shut the cross-domain door. IMO, a better option that would have prevented many hours of debugging and tracing would have been to detect that Javascript attempts CORS (jQuery.support.cors=true) and explain the steps to change the default settings or, better yet, implement CORS preflight as the other browsers do (Chrome submits OPTIONS to ask the server if the operation is allowed before the actual POST).
UPDATE 9/10/2013 When using the web server built in Visual Studio and you debug/test the browser opens the page with localhost:portnumber. However, the browser (I tested this with IE and Chrome) does not consider the port to be a part of the Security Identifier (origin) used for Same Origin Policy enforcement and the call will fail.
https://prologika.com/wp-content/uploads/2016/01/logo.png00Prologika - Teo Lachevhttps://prologika.com/wp-content/uploads/2016/01/logo.pngPrologika - Teo Lachev2013-09-10 02:30:002021-02-16 04:29:23Web API CORS Adventures