Atlanta MS BI Group Meeting on May 19th

Join us for our next Atlanta MS BI Group meeting tomorrow, Monday, May 19th, to learn about Power Query. Spread the word and invite your coworkers but RSVP on our website so we can plan food accordingly.

Main Presentation:Power Query
 Level: Intermediate
Date:Monday, May 19th, 2014
Time6:30 – 8:30 PM ET
Place:South Terraces Building (Auditorium Room)

115 Perimeter Center Place

Atlanta, GA 30346
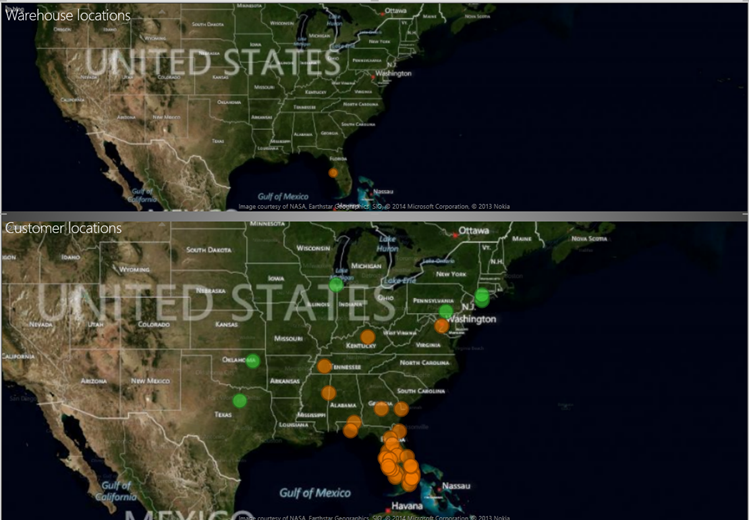
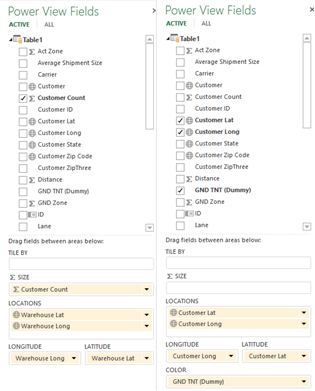
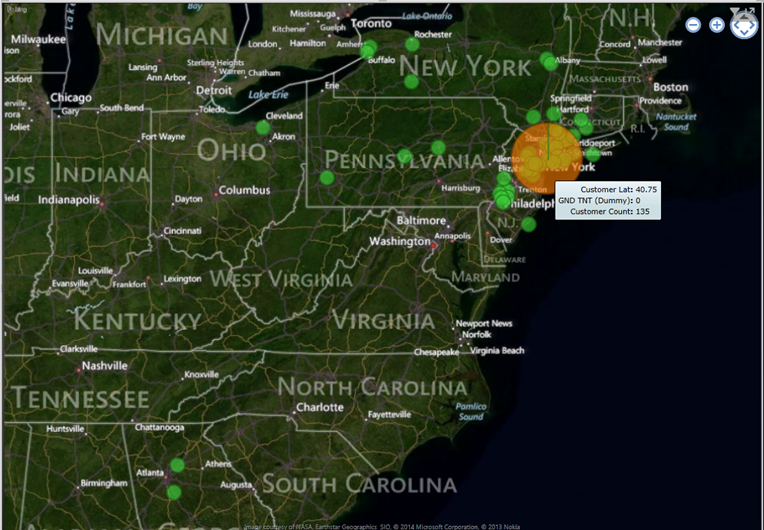
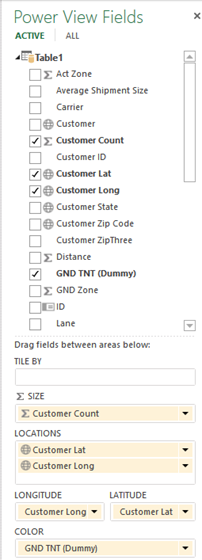
Overview:So much data is stored on the web, yet merging it with our enterprise data can be a challenge. In this session we’ll use Power Query to quickly harvest historical data about SQL Saturday from its site, combining event, session and speaker details with other publicly available data sets. We’ll create custom functions with Power Query’s M language to collect and transform the data from multiple web pages. We’ll then move the data into Power Pivot and explore our results with Power View and Power Map. We’ll even cleanse the data without leaving Excel, leveraging DQS (Data Quality Services) through the MDS (Master Data Services) Excel add-in.
Speaker:Julie Smith is a Microsoft SQL Server MVP and a BI consultant for Innovative Architects in Atlanta, GA. She’s implemented increasingly complex ETL solutions for over a decade at various organizations. She’s also worn many other database “hats” in her career – production DBA and database developer–but ETL is her true passion. Julie is an MCTS in SQL Server 2008 BI and holds a BA from the University of South Carolina. She and Audrey Hammonds co-created The Datachix.com blog.

Rob Volk is a SQL Server DBA in the Metro Atlanta area since 2001. An MCITP, he also moderates and answers the forums on SQLTeam.com. While an old-time cranky DBA, he no longer considers “business intelligence” an oxymoron and is delightedly dipping his toes into the BI ocean, and loves to do things in new and unusual ways.

Sponsor:Since 2005, Innovative Architects has been serving industries to help solve business and technology challenges. Led by our great associates, we specialize in a wide array of cutting edge Microsoft technologies that we leverage to help our customers achieve the highest level of success with their technology solutions. We provide business consulting, development and implementation services for Microsoft platforms which include BizTalk, SharePoint, .NET, Business Intelligence and much more.
Prototypes with PizzaPower BI Forecasting by Teo Lachev

Calculating Inception-to-Date Measures

A requirement popped up for calculating an inception-to-date (ITD) measure.

MDX CALCULATED MEMBER

Aggregate(PeriodsToDate ([Date].[Calendar Hierarchy].[(All)]), [Measures].[Sales Amount])

In MDX, ITD is not much different than other time calculations, such as YTD or QTD. We only need to specify that the calculation will be performed over the top-most level of the Date hierarchy whose default name is ([Date].[Calendar Hierarchy].[(All)]. Of course, time calculations should be added to a shell dimension and a scope assignment can be used then in the cube script:

Scope (

[Accounting Date].[Calendar Year].[Calendar Year].Members,

[Accounting Date].[Date].Members ,

[Relative Date].[ITD]

);


this =

Aggregate

(

{[Relative Date].[PTD]} * PeriodsToDate ([Date].[Calendar Hierarchy].[(All)])

);

End
Scope;

DAX MEASURE

=CALCULATE(SUM(‘Reseller Sales'[Sales Amount]), FILTER(ALL(‘Date’), ‘Date'[Date] < MAX(‘Date'[Date])))

In DAX, we pass a table consisting of the dates we need to aggregate over as a second argument of the CALCULATE function. We need to use the ALL function to ignore the row context of the Date table in order to calculate the date range by filtering the date table until the current period. The MAX function is used to get the last date of the current period on the report, e.g. 10/31/2012 if the month is October 2012.

3 Techniques to Save BI Implementation Effort

Everyone wants to press a button and have the entire BI system generated and ready to go. But things are not that simple. You know it and I know it. Nevertheless, BI automation tools are emerging with growing promises that propelled them to the Top 10 BI Trends according to the Information Management magazine. As a side note, it was interesting that the same article put Big Data in the No 1 spot despite that Gartner deemphasized the Big Data hype (based on my experience and polling attendees to our BI group meetings, many don’t even know what Big Data is). While I don’t dismiss the BI auto-generators can bring some value, such as impact analysis and native support of popular systems, such as ERP systems, there are also well known cautions, include vendor lock-in, a new toolset to learn, suboptimal performance, supporting the lowest feature denominator of targeted database, etc. However, you don’t have to purchase a tool to save redundant implementation effort. Instead consider the following techniques:

  1. Use the ELT (extraction, load, and transform) pattern instead or ETL (extract, transform, and load). While different solutions require different patterns, the ETL pattern is especially useful for data warehouse implementation because of the following advantages:
    1. Performance – Set-based processing for complicated lookups should be more efficient than row-by-row processing. In SQL Server, the cornerstone of the ETL pattern is the T-SQL MERGE statement which resolves inserts, updates, and deletes very efficiently.
    2. Features – Why ignore over two decades of SQL Server evolution? Many things are much easier in T-SQL and some don’t have SSIS counterparts.
    3. Maintenance – It’s much easier to fix a bug in a stored procedure and give the DBA the script than asking to redeploy a package (or even worse a project now that we’ve embraced the project model in SSIS 2012).
    4. Upgrading – As we’ve seen, SQL Server new releases bring new definitions that in many cases require significant testing effort. Not so with stored procedures.
    5. Scalability – if you need to load fact tables, you’d probably need to do partitions switching. This is yet another reason to stage data first before you apply transformations.
  2. Automate the generation of stored procedure. The ELT pattern relies heavily on stored procedures. If you have to populate a lot of tables, consider investing some upfront development effort to auto-generate stored procedures, such as by using the Visual Studio Text Templates (also known as T4) templates. Note that to be able to debug them in Visual Studio 2012, you would need to add the template to a .NET project, such as a console application.

5415.2014-05-10_19-22-41.png-550x0

3.  Automate the generation of SSIS packages. If you embrace the ELT pattern, your SSIS packages will be simple. That’s because most of the ELT code will be externalized to stored procedures and you would only use SSIS to orchestrate the package execution. Yet, if you have to create a lot of SSIS packages, such as to load an ODS database, consider automating the processing by using the Business Intelligence Markup Language (BIML) Script. BIML is gaining momentum. The popular BIDS Helper tool supports BIML. And, if you want to take BIMS to the next level, my friends from Varigence has a product offering that should help.

How to Test SSRS Data Alerts without Corporate Mail Server

Reporting Services data alerts were introduced in SQL Server 2012 to allow business users to receive e-mail notifications based on rules they specify. Data alerts require SSRS to be configured in SharePoint integration mode. However, you’d probably run SharePoint on a VM for development and demo purposes and you might not have access to a functional mail server. The following steps allow you to configure your VM to test data alerts with a local SMTP server:

  1. Assuming your SharePoint VM is running Windows Server 2012, open Turn Windows Features On and Off and add the SMTP Server feature. This will install a local SMTP server.
  2. Open IIS Manager 6.0 and start the SMTP Virtual Server. Configure the SMTP server to allow relay.
  3. Because SSRS 2012 integrates natively with SharePoint, you can’t use the report server configuration files to directly change the SSRS settings. Instead, you must use PowerShell as I explained here. Open Windows PowerShell ISE and execute the following script to configure the SSRS e-mail settings. Replace <your SSRS application name> with the name of your SSRS application which you can obtain from the SharePoint Central Administration ð Manage Service Applications. Execute the script.

    051014_2250_HowtoTestSS1

    Add-PSSnapin Microsoft.SharePoint.PowerShell

    $app=get-sprsserviceapplication -Name “<your SSRS application name>”

    $emailCfg = Get-SPRSExtension -identity $app -ExtensionType “Delivery” -name “Report Server Email” | select -ExpandProperty ConfigurationXml

    $emailXml = [xml]$emailCfg

    # $emailXml.SelectSingleNode(“//SMTPServer”).InnerText = “<email server name>”

    $emailXml.SelectSingleNode(“//SendUsing”).InnerText = “1”

    $emailXml.SelectSingleNode(“//SMTPAuthenticate”).InnerText = “2”

    $emailXml.SelectSingleNode(“//SMTPServerPickupDirectory”).InnerText = “C:\inetpub\mailroot\Pickup” # You probably don’t need this; I was experimenting with dropping the messages to a pickup folder

    $emailXml.SelectSingleNode(“//From”).InnerText = ‘teo.lachev@prologika.com’

    Set-SPRSExtension -identity $app -ExtensionType “Delivery” -name “Report Server Email” -ExtensionConfiguration $emailXml.OuterXml

  4. If you haven’t configured the data alerts before, go to SharePoint Central Administration ð Manage Service Applications ð <Your SSRS Application>, and then click Provision Subscriptions and Alerts. If you have admin permissions to the SQL Server that hosts the SharePoint databases, enter your credentials and click OK to grant the SSRS service account access to the SQL Server Agent (the SQL Server Agent Service must be running for the data alerts to work). If you don’t, then click the Download SQL Script link and give the script to the DBA to execute the script in order to grant the SSRS service account these permissions.
  5. Now, create a data alert as usual and run it from the Manage Data Alerts page. After you manually run the alert, you shouldn’t see an error in the Status column.051014_2250_HowtoTestSS2
  6. Go to the SMTP service queue folder, the default one is C:\inetpub\mailroot\Queue. You should see files with extension *.EML. You can open these files with Microsoft Outlook to see the details of the e-mail notification that SSRS sends to the recipient. It should look like the one below. In this case, I’ve create a report that shows the status of the SharePoint timer jobs and I wanted to be notified every time the Status=3.

051014_2250_HowtoTestSS3

Point-to-point Geo Adventures

Scenario: You need to visualize point-to-point geospatial data, such as routes from an origin location to destinations. The map region in Reporting Services (Report Designer or Report Builder) supports point-to-point mapping but more than likely your users would prefer an interactive report. As they stand, neither Power View nor Power Map support point-to-point mapping. Further down on the limitation list, Power View doesn’t support layers while Power Map does support layers but doesn’t support filtering, e.g. to allow the end user to select a specific origin. Point-to-point mapping is a frequently requested feature which I hope Microsoft will implement in a not so distant future. Meanwhile, you need to resort to workarounds.

Workaround 1: If all the user wants to see is how far the destinations are located relative to a specific origin, consider creating a Power View report with two maps. The first map would allow the user to filter the origin and second map would plot the associated destinations. In the report below, the user has filtered a specific warehouse which is plotted on the first map. The second map shows the locations of the customers who receive shipments from that warehouse.

050514_0022_Pointtopoin1

The following screenshot show you how the first and second maps are configured:

050514_0022_Pointtopoin2

Workaround 2: If you prefer plotting both the origin and destinations on a single map, consider modifying your input dataset (Power Query can help automating this so you don’t have to do it manually) to append the distinct set of origins so you end up with both origins and destinations sharing the same latitude and longitude columns. In other words, you’ll append the origin set consisting of a distinct set of origins one more time to the original dataset. Then, you might want to introduce a Type column, e.g. with values Warehouse and Customer, to denote the type of each row. So that the origin stands out on the map, consider adding a DAX calculated column that does a distinct count over the destinations associated with that origin and use this column for the bubble size. Assuming a single dataset, this calculated column might use the following expression:

Customer Count:=IF([Type]=”Warehouse”, CALCULATE(DISTINCTCOUNT([Customer ID]), ALLEXCEPT(Table1, Table1[Warehouse ID])),BLANK())

Then, the map report can plot both origin and destinations.

050514_0022_Pointtopoin3

The following screenshot shows how the map is configured.

050514_0022_Pointtopoin4