Atlanta MS BI Group Meeting on Aug 25th

Join us tonight for a knowledge-packed meeting of Atlanta MS BI Group to learn how to optimize and automate your ETL.

Presentation:Making your SSIS Fly Beyond the Sky
 Level: Intermediate to Advanced
Date:Monday, August 25th, 2014
Time6:30 – 8:30 PM ET
Place:South Terraces Building (Auditorium Room)

115 Perimeter Center Place

Atlanta, GA 30346

Overview:How fast can an ETL package be? How big of a dataset is too big causing us to wait several hours to load data? Do you know those properties that you never touched because you were afraid to break something else? Well, let’s try them. In this demo-rich presentation, we’ll focus on some 101 tips that will maximize your package throughput. We will also go deeper toward a 200-300 level, when we will walk through some very interesting database design patterns that will ultimately affect the performance of your SSIS.
Speaker:Carlos Rodrigues has more than 15 years of experience, and most of it with Business Intelligence. Adept in implementing state-of-art Business intelligence and Data warehouse solutions using the entire Microsoft BI toolset, he currently manages onsite, offshore and remote teams but he remains technical and hands-on, and up to date with new technologies. Carlos delivered a few presentations for the Atlanta BI Group and Atlanta SQL Saturday. He follows Ralph Kimball’s school of thought.
Sponsor:Halo BI is dedicated to the simple principle that data is dumb; it’s people who provide the intelligence. No software package, no matter how fast it collects, processes or displays data, will ever deliver “business intelligence”. We are about developing technology to enable real business intelligence — the human kind.

Where is SSDT?

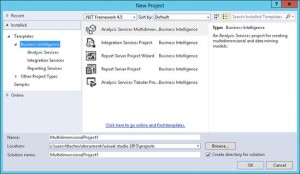
Now that Microsoft has decoupled SQL Server Data Tools from the SQL Server 2014 setup, the quest to find SSDT has started. You can download SSDT from the Microsoft SQL Server Data Tools page. Note that to get the BI project templates, you need the SSDT-BI install depending on the Visual Studio version you have (scroll all the way down the page to see the SSDT-BI links). If you don’t have Visual Studio installed (you probably don’t need it if you don’t code), I suggest you pick the latest, which as of this writing is Download SSDT-BI for Visual Studio 2013.

To make things a bit more interesting, Microsoft threw in another gotcha. When you run the SSDT setup, it will ask you if you want to install a new instance of SQL Server or add features to the existing instance. If you have SQL Server already installed, you might opt to add features to the current instance but you’ll be greeted later on with a rule violation “The CPU architecture of installing feature(s) is different than the instance specified. To continue, add features to this instance with the same architecture.” I have no idea what’s complaining about here given that when I tried this I had a brand new instance of SQL Server 2014 installed. It looks like we have a bug report on this already.

Although it doesn’t make much sense, the correct choice is to create a new instance although the setup won’t be creating any new instances since we are installing only SSDT here. After the install, you can start SSDT and see the beloved BI project templates.

1856.ssdt.jpg-550x0

SSRS Style Templates

As you probably know, the SSRS Report Wizard allows users to select predefined report styles. These styles are basic “skins” that apply to report foreground and background colors.

3124.styles.jpg-550x0

A question came in from a student as to how to modify/add styles. You can alter the existing style templates or add new ones by editing the StyleTemplates.xml file in the \Program Files (x86)\Microsoft Visual Studio 10.0\Common7\IDE\PrivateAssemblies\Business Intelligence Wizards\Reports\Styles\<language> folder. You need to make this change on the client machine where SSDT is installed.

On the subject of styles, recall that starting with SQL Server 2008 R2, SSRS supports report parts to promote report reuse and reduce maintenance.

Absolute Tabular KPIs

An interesting requirement popped up during an Analysis Services class I’m teaching this week. The customer wants to implement a Tabular/PowerPivot KPI that has this pseudo logic:

CASE

WHEN Actual Below Goal && Below LastYearSales Then Red

WHEN Actual Below Goal && Above LastYearSales Then Yellow

WHEN Actual >= Goal Then Green

END


Although I’m using Tabular, the same calculations will work with Power Pivot.

  1. Define a LastYearSales measure using the following formula assuming that the measure for the actual amount will be ResellerSales[SalesAmount]
    =CALCULATE(SUM(ResellerSales[SalesAmount]), PREVIOUSYEAR(‘Date'[Date]))
  2. Define a measure for the KPI actual value using the formula:

=SWITCH(TRUE(),

SUM(ResellerSales[SalesAmount])<Sum(SalesQuotas[SalesAmountQuota]) && SUM(ResellerSales[SalesAmount])<[LastYearSales],-1,

SUM(ResellerSales[SalesAmount])<Sum(SalesQuotas[SalesAmountQuota]) && SUM(ResellerSales[SalesAmount])>[LastYearSales],0,

SUM(ResellerSales[SalesAmount])>=Sum(SalesQuotas[SalesAmountQuota]),1

)

This measure using the DAX Switch function. However, to use it as a searched case expression, we use a trick where first argument returns TRUE and the rest of the conditions are evaluated against this hardcoded Boolean value. The formula normalizes the status as -1 (Red), 0 (Yellow), and 1 (Green).

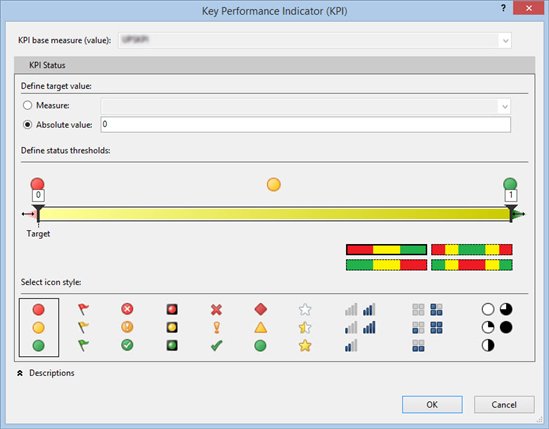
  1. Define the KPI. Notice that the KPI uses an absolute value of 0 for the target.

    7356.kpi.jpg-550x0

    TIP: If you use Tabular, instead of using the UI you can open the BIM file source code, locate the _KPI Status measure and modify it as follows:

    CREATE MEASURE ‘ResellerSales'[KPI]=SWITCH(TRUE(),
    SUM(ResellerSales[SalesAmount])&lt;Sum(SalesQuotas[SalesAmountQuota]) &amp;&amp; SUM(ResellerSales[SalesAmount])&lt;[LastYearSales],-1,
    SUM(ResellerSales[SalesAmount])&lt;Sum(SalesQuotas[SalesAmountQuota]) &amp;&amp; SUM(ResellerSales[SalesAmount])&gt;[LastYearSales],0,
    SUM(ResellerSales[SalesAmount])&gt;=Sum(SalesQuotas[SalesAmountQuota]),1
    );
    CREATE MEASURE ‘ResellerSales'[_KPI Goal] = 0;
    CREATE MEASURE ‘ResellerSales'[_KPI Status] = if(ISBLANK(‘ResellerSales'[KPI]),BLANK(),
    If(‘ResellerSales'[KPI]&lt;0,-1,
         If(‘ResellerSales'[KPI]&lt;1,0,1)
    );

Excel Timeline Slicers

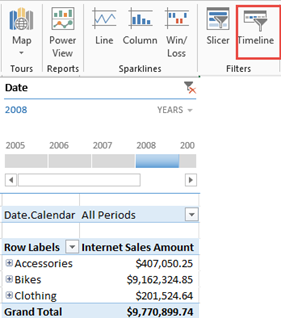
In an attempt to improve visualizations of Excel-based dashboards, Excel 2013 introduced a Timeline filter. Specifically designed to visualize dates, the Timeline filter works similarly to regular slicers which were introduced in Excel 2010. Similar to a regular slicer, Timeline connects at the connection level and is capable of filtering multiple reports. It supports also extended selections, such as to select multiple years.

080514_0129_ExcelTimeli1

However, there are important differences between Timeline and regular slicers which become important when you connect to Multidimensional.

  1. The Timeline slicer always generates a subselect clause in the resulting MDX query even if a single value is selected. Because of this, the CurrentMember of the Date dimension is not set and any time calculations that dependent on [Date].[Hierarchy].CurrentMember won’t work. By contrast, a regular slicer is more intelligent. If the user selection results in a single value, a WHERE clause is generated and CurrentMember works. If multiple values are selected then it generates a subselect and CurrentMember won’t work.
  2. If the report has a report-specific filter, such as in the example above, Timeline forces the filter to its default value (All Periods if the All member is the default member or whatever the default member is set to in the cube). If the default filter is overwritten in the cube, such as to default the date to the last date with data, the report-specific filter and the Timeline selection might result in an exclusive filter and then no results will be shown. By contrast, a regular slicer always passes the user selection to the report filters.

Here is a sample MDX query generated by Excel when Timeline is set to year 2007.

SELECT NON EMPTY Hierarchize({DrilldownLevel({[Product].[Product Categories].[All Products]},,,INCLUDE_CALC_MEMBERS)}) DIMENSION PROPERTIES PARENT_UNIQUE_NAME,HIERARCHY_UNIQUE_NAME ON COLUMNS FROM (SELECT Filter([Date].[Date].Levels(1).AllMembers, ([Date].[Date].CurrentMember.MemberValue>=CDate(“2007-01-01”) AND [Date].[Date].CurrentMember.MemberValue<CDate(“2008-01-01”))) ON COLUMNS FROM [Adventure Works]) WHERE ([Date].[Calendar].[All Periods],[Measures].[Internet Sales Amount]) CELL PROPERTIES VALUE, FORMAT_STRING, LANGUAGE, BACK_COLOR, FORE_COLOR, FONT_FLAGS

And here is the resulting MDX from a regular slicer set to year 2007 (notice the WHERE clause):
SELECT NON EMPTY Hierarchize({DrilldownLevel({[Product].[Product Categories].[All Products]},,,INCLUDE_CALC_MEMBERS)}) DIMENSION PROPERTIES PARENT_UNIQUE_NAME,HIERARCHY_UNIQUE_NAME ON COLUMNS
FROM [Adventure Works] WHERE ([Date].[Calendar].[Calendar Year].&[2007],[Measures].[Internet Sales Amount])
CELL PROPERTIES VALUE, FORMAT_STRING, LANGUAGE, BACK_COLOR, FORE_COLOR, FONT_FLAGS

If you decide to use Timeline, use it only with reports that don’t include calculations that rely on date current member. Ideally, a future Excel enhancement would make Timeline behave as a regular slicer to increase its usefulness and align its behavior with regular slicers.