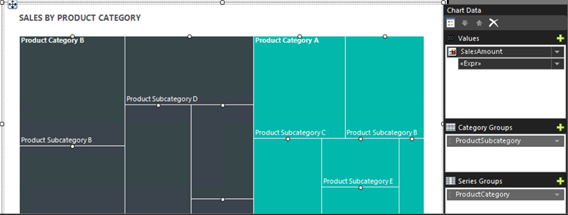
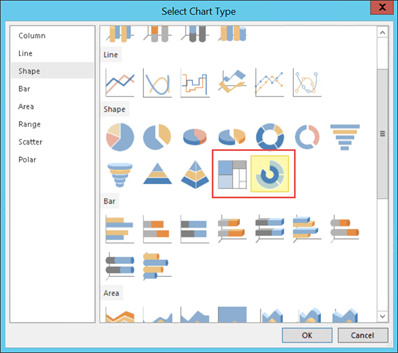
Years ago, I wrote a blog about how, with some code wizardry, you can create heat maps with Reporting Services. Moving to SSRS 2016, you don’t have to do this anymore thanks to the new Treemap chart type!
Speaking of new charts, SSRS also adds a Sunburst chart.
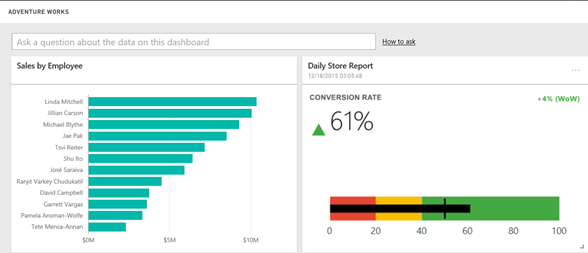
As I said in the “Microsoft Unveils BI Roadmap” blog, SSRS will play an important role of the on-premises BI portal. With this post, I’ll start covering the new SSRS 2016 features. One of the Power BI features announced at the PASS Summit was the forthcoming integration between SSRS 2016 and Power BI that will allow users to pin SSRS report items to Power BI dashboards. You can test pining reports items to Power BI with SQL Server 2016 CTP 3.0 and later. The newly released CTP 3.2 also features the new sleek SSRS portal (we’ve come a long way!). The items you can pin currently include charts, gauge panels, maps, and images. Pinning a report item takes a few clicks:
Open the report and click the Power BI button (a new toolbar button in SSRS 2016). If this is the first time you do this, you’ll be asked to authenticate with Power BI and grant SSRS special permissions it needs for pinning. Then, SSRS switches to a special page mode that shows which items can be pinned.
Click the tile you want to pin.
In the “Pin to Power BI Dashboard” window, select the dashboard you want to pin the report to and the update frequency that specifies how often Power BI will query the report for data changes.
And, the report item is pinned to the dashboard as a regular tile. You can click the tile to navigate back to the SSRS report.
As you can see, Power BI is becoming a focal point for cloud hosting of the main MS report artifacts: Power BI reports, Excel reports, and SSRS reports.
https://prologika.com/wp-content/uploads/2016/01/logo.png00Prologika - Teo Lachevhttps://prologika.com/wp-content/uploads/2016/01/logo.pngPrologika - Teo Lachev2015-12-18 03:51:002021-02-16 04:59:57Integrate SSRS 2016 Reports with Power BI
To me, Power BI is the most exciting milestone in the Microsoft BI journey since circa 2005, when Microsoft got serious about BI. Power BI changes the way you gain insights from data; it brings you a cloud-hosted, business intelligence and analytics platform that democratizes and opens BI to everyone.
I’m happy to announce my latest (7th) book – Applied Microsoft Power BI. Currently, the one and only book on Power BI. Some people discouraged me to write this one. After all, trying to cover a product that changes every week is like trying to hit a moving target. However, I believe that the product’s fundamentals won’t change and once you grasp them, you can easily add on knowledge as Power BI evolves over time. Because I had to draw a line somewhere, “Applied Microsoft Power BI” covers all features that were announced at the PASS Summit 2015 and that were released by December 2015.
The book has four parts for each of the four user types: information worker, data analyst, pro, and developer. Information workers will learn how to connect to popular cloud services to derive instant insights, create interactive reports and dashboards, and view them in the browser and on the go. Data analysts will discover how to integrate and transform data from virtually everywhere, and then implement sophisticated self-service models. The book teaches BI and IT pros how to establish a trustworthy environment that promotes collaboration and how to implement Power BI-centric solutions for descriptive, real-time, and predictive analytics. Developers will find how to integrate custom applications with Power BI, embed reports, and implement custom visuals to present effectively any data.
The book is making its way slowly through the retail channels but it should be available on Amazon (in both paper and Kindle formats) and with other retailers before the holidays. I’ll drop a note and update the book page once the book is available for purchase. Meanwhile, visit the book page for more information about the book, source code, and a sample chapter (Chapter 1 “Introduction to Power BI”).
I predict that 2016 will be the year of Power BI and I hope that this book will help you bring your data to life!
https://prologika.com/wp-content/uploads/2016/01/logo.png00Prologika - Teo Lachevhttps://prologika.com/wp-content/uploads/2016/01/logo.pngPrologika - Teo Lachev2015-12-16 19:26:002016-02-20 14:32:56The One and Only Power BI Book
A sparkline is a miniature graph, typically drawn without axes or coordinates. Commonly used on dashboards, sparklines typically visualize trends over time, such as to show profit over the past several years. Although other Microsoft reporting tools, such as Excel and Reporting Services include sparkline elements, Power BI doesn’t have one. That is until now.
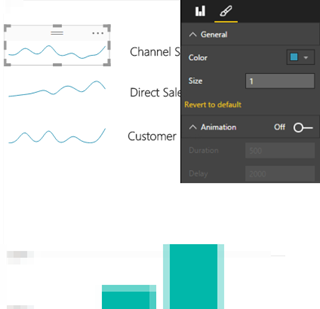
I contributed a “classic” sparkline custom visual to the Power BI Visuals Gallery. Once you import and add the sparkline to a report, you bind the sparkline to data using the Data tab of the Visualization pane. For example, you can aggregate a Freight field added the Value area over the CalendarQuarterDesc field added to the Category area. The resulting graph will sho how freight fluctuates over time. You can use any field to group the data, not just a field from the Date table.
The sparkline supports several formatting options. The General section lets you change the line color and width. The default properties are “steelblue” as a color and one pixel for the line width. The Animation section lets you turn on an animation effect that draws the line gradually from left to right (who says that Power BI visuals have be to static?) Although in general I advise against animations and other visual distractors in real-life reports, I wanted to emphasize the point that Power BI visuals can support anything clients-side JavaScript can do. The Duration setting controls how fast the line draws (the default setting is 1,000 milliseconds) and the Delay settings controls the interval between redraws (the default is 3,000 milliseconds). The sparkline supports also a tooltip. When you hover anywhere on the viewport, a tooltip pops up that shows the name of the field added to the Value area and the data point values.
The main limitation of the current implementation is that similar to the Power BI gauge visualization, it doesn’t render over multiple lines, such as for each product category on rows. Preferably, at some point Power BI would support a repeater control similar to the SSRS Tablix region. This would allow nesting the sparkline into other visualizations, such as a table, that will repeat the sparkline for each row. As Power BI stands now, the only way to implement this feature is to draw the visual for each value of the category field, which would require also drawing labels for the row categories. However, it doesn’t repeat on rows, the sparkline could be used to display multiple measures arranged either horizontally or vertically as the screenshot shows. Another limitation related to the previous I’ve just discussed is that it supports only a single field in the Category area and a single field in the Value area. In other words, the sparkline is limited to one measure and one group. Continuing on the list of limitations, the tooltip displays the same information irrespective where you hover on the sparkline viewport as opposed to showing just the value of the data point behind the cursor.
I hope you’ll find my sparkline useful not only for your real-life projects but also for learning how to implement custom visuals.
Those of you who had to generate programmatically Tabular models or make changes to the schema would agree that it was more complicated that it should have been. That’s because Tabular borrowed the schema from Multidimensional so objects had to be defined in different places and in the SSAS MD terminology (dimensions, DSVs, etc). SQL Server 2016 CTP3 brings a new and much more simplified Json-based schema for describing SSAS Tabular models. To see it, you need to configure your workspace database in SQL Server 2016 (1200) compatibility mode. SSMS doesn’t yet support the new schema but you can take a look at Model.bim once you create your project. When you open the source of the Model.bim file you’ll see something completely different than the XML schema you were used to:
So faster Tabular schema operations in SQL 2016 and much easier model auto-generation. Now all we need is a programmatic way to work with the new schema and this should probably come soon.
https://prologika.com/wp-content/uploads/2016/01/logo.png00Prologika - Teo Lachevhttps://prologika.com/wp-content/uploads/2016/01/logo.pngPrologika - Teo Lachev2015-11-13 03:42:462016-02-12 06:32:40New Tabular Schema in SQL Server 2016
Continuing the line of thought from my previous blog “Microsoft Unveils BI Roadmap”, one nagging question still remains. What to do with all these Excel files now that SSRS came with a vengeance and has been promoted to THE on-premises BI platform? It looks like Microsoft is thinking along these lines. Interestingly, Excel Services will be removed from SharePoint Server 2016 and replaced with Office Online Server, as explained here. And this page gives more details about Office Online Server which is currently in preview. In a nutshell, Excel rendering would work pretty much in the same way as in SharePoint Server 2013. The most common scenario that Microsoft plans now is to have the Excel workbook in SharePoint. When you open the workbook, SharePoint will redirect you to the Office Online Server using a WOPI frame (some sort of an Iframe), with some special tokens that enable Office Online Server to retrieve the workbook from SharePoint, and then render it as usual. This will work for Power Pivot models as well. Office Online Server (OOS) also supports loading Excel files from OneDrive which is how Power BI Excel rendering works today.
But wouldn’t be nice to extend SSRS 2016 and integrate with OOS so that you can deploy Excel reports to a report server installed in native mode? This would allow SSRS to handle all of the important Microsoft report formats (SSRS, Datazen, Power BI Desktop, and Excel). If OOS doesn’t require a SharePoint license, this will be a great value proposition as well as you will save you a SharePoint Server Enterprise Edition license. This is precisely the wish I communicated to Microsoft and posted it on the Excel wish list. Please vote if you like the idea.
You know that there is an Excel wish list site, right?
Today at the SQL PASS Summit 2015, Microsoft shared its BI roadmap for next year and beyond. The BI cloud roadmap shouldn’t be a surprise to anyone. It’s centered around Power BI. The main takeaway about the on-premises roadmap is deemphasizing the role of SharePoint and Office in favor of Reporting Services. In SQL Server 2016, SSRS will be extended to support Datazen reports. A future SQL Server update would support publishing Power BI Desktop files as well.
“Just as we’ve added mobile report delivery to SSRS in SQL Server 2016, we intend to add governed Power BI Desktop report delivery in the future.”
Although this news will surely cause some commotion in a short term, I believe it’s a good news for customers and BI practitioners in a long term. For customers, you no longer need SharePoint and SQL Server Enterprise licenses if all you need is sharing some reports and dashboards. So, this move brings significant cost savings in both software licenses and operational expenses. However, if you have invested in SharePoint you can continue using its BI features in SharePoint Server 2013 and beyond. For BI practitioners, you no longer need to deal with SharePoint complexities. MVP and the community have been asking for years for a simplified deployment model and now we have it. And removing SharePoint and Office dependencies will remove adoption barriers caused by aligning release cycles across different Microsoft product groups.
I’m personally glad that SSRS was chosen as the workhorse of the on-premises BI roadmap. SSRS is a mature product and it’s a natural choice to step up to its new role. Apparently, it’s not trivial to decouple the Power BI Service from all the Azure backend infrastructure so we can host it on premises. Long live SSRS!
UPDATE: An updated sample is included in the Chapter 12 source code of my “Applied Power BI” book.
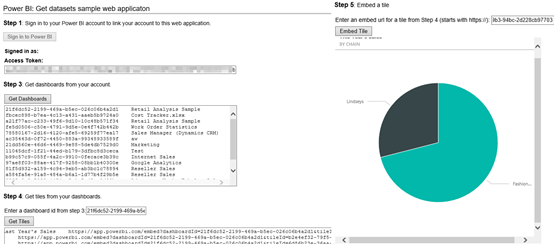
One of the biggest Power BI strengths is its open architecture. In addition to opening the visualization framework, Power BI introduced REST APIs that let developers embed dashboard tiles in custom web applications (embedded reports will probably follow soon). Microsoft provided a sample application (Integrate-a-tile-into-an-app) on GitHub to demonstrate how dashboard tile embedding works. This application navigates the user to an authentication UI where the user signs it to Power BI before the application can access the user content. However, there are plenty of embedded reporting scenarios where this isn’t desirable. For example, you might have a web application that already authenticates users with Forms Authentication and you don’t want to ask the user to log in to Power BI again. Instead, you might want to pass the identity of the authenticated user to Power BI. In the more advanced (but increasingly common) scenario, you would want Power BI to pass the user identity all the way to an on premises Analysis Services model so that data security works.
The bad news is that currently Power BI doesn’t support custom security. Custom security is on the roadmap but currently you can’t pass application users to Power BI. This isn’t as bad as it sounds. For example, if you have a limited number of users or external customers, you can register them in Power BI so that you know their Power BI usernames and passwords. For example, if my company does business with Acme1 and Acme2, I could register acme1@prologika.com and acme2@prologika.com with PowerBI. Then, once the acme1 user authenticates with my web application and request a dashboard, I can authenticate the user with acme1@prologika.com to Power BI.
The good news is that Power BI supports OAuth2 for security. OAuth2 is a very flexible security mechanism and it supports different flows via the grant_type parameter. One of the flows that it supports is the grant_type=password flow that allows you to avoid the Power BI authentication UI step if you know the user credentials. This is conceptually similar to how Basic Authentication works. The OAuth2 grant_type=password scenario is also referred to as two-leg authentication (the three-leg authentication is when the Authentication UI is involved).
To demonstrate this, I’ve made changes to the Microsoft sample app and uploaded the modified sample (attached to this blog). Configure it in Visual Studio as follows:
In the application settings, change the ClientSecret, ClientID, UserName, and Password to match your setup. You obtain ClientID and ClientSecret when you register the application with Azure AD. The username and password must match the credentials of a registered Power BI user.
In the application Build tab, make sure that the NOLOGIN conditional symbol exists.
Right-click on the project and then click Manage NuGet packages. Download and install all referenced packages as they are not packaged with the sample to reduce size.
Run the application. The “Sign in to Power BI” button should be disabled. When you click Get Dashboards, the app should be able to retrieve the dashboards on behalf of the Power BI user. From this point on, the app works as per the original sample. Again, the big difference is that the Authentication UI is not shown because you don’t need to collect the user credential.
Special thanks to the Power BI Team and Rui Quintino by DevScope for sharing insights. For more information about how APIs for embedded dashboard tiles work, read the “Power BI API updates roundup” blog by Lukasz Pawlowski.
In summary, the sample demonstrates how you can use OAuth2 two-leg flow to avoid authenticating the user twice and redirecting to the Power BI authentication dialog. As a disclaimer, this is not a production-ready sample (there are hardcoded links, no error handling, no refresh token flow, etc.).
https://prologika.com/wp-content/uploads/2016/01/logo.png00Prologika - Teo Lachevhttps://prologika.com/wp-content/uploads/2016/01/logo.pngPrologika - Teo Lachev2015-10-19 13:43:002021-02-16 04:59:56Power BI Embedded Dashboards Without Authentication UI
Microsoft awarded me again with the Most Valuable Professional (MVP) Award for SQL Server. This is an annual prestigious award given to selected individuals worldwide in recognition for their expertise and contribution to the community. Currently, there are 371 SQL Server MVPs worldwide and only 85 in the USA. This makes it 12 consecutive years for me as SQL MVP!
https://prologika.com/wp-content/uploads/2016/01/logo.png00Prologika - Teo Lachevhttps://prologika.com/wp-content/uploads/2016/01/logo.pngPrologika - Teo Lachev2015-10-06 12:17:022016-02-12 06:50:06SQL Server MVP for 12 Years
Come and join us on Monday, September 28th, for our next Atlanta MS BI Group meeting. The topic this time is “Enhancing Data Analysis and Predictive Analytics with NoSQL” delivered to you by RDA Consulting.
Presentation:
Enhancing Data Analysis and Predictive Analytics with NoSQL
Level: Intermediate
Date:
Monday, September 28th, 2015
Time
6:30 – 8:30 PM ET
Place:
South Terraces Building (Auditorium Room)
115 Perimeter Center Place
Atlanta, GA 30346
Overview:
The pervasiveness of Big Data has created significant challenges for companies that have historically utilized relational database management systems to perform data analysis and predictive analytics. This presentation outlines the challenges that stem from Big Data as it relates to deriving value from data, the types of NoSQL data stores available and how NoSQL can serve as a data platform that enhances the data analysis and predictive analytics capabilities of companies.
Speaker:
Cornell A. Emile is a Senior Software Engineer with RDA Corporation. Since 2001, he has designed, developed, and maintained a data-centric solutions within multiple industries such as Finance, Digital Marketing, State and Federal Government using Microsoft’s BI stack. His main interests include database performance tuning, ETLs, Business Intelligence and NoSQL.
Sponsor:
RDA provides specific enterprise solutions that integrate software, managed services, and the value of the cloud. We help you assess the best platforms, then design, build, implement and support tailored business solutions that optimize to your specific cost, scale, mobility and security needs.
https://prologika.com/wp-content/uploads/2016/01/logo.png00Prologika - Teo Lachevhttps://prologika.com/wp-content/uploads/2016/01/logo.pngPrologika - Teo Lachev2015-09-26 23:39:322016-02-12 06:52:05Atlanta MS BI Group September 28th Meeting