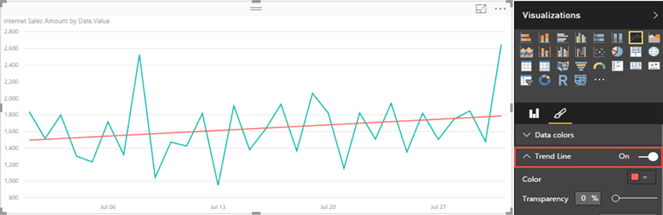
Recently, Power BI charts introduced trend lines. However, they require numeric or date values on X-axis, which must have a continuous type. In fact, if you use a text field for the X-axis, a warning indicator will be displayed in the top left corner of the chart to warn you that non-numeric values are used.
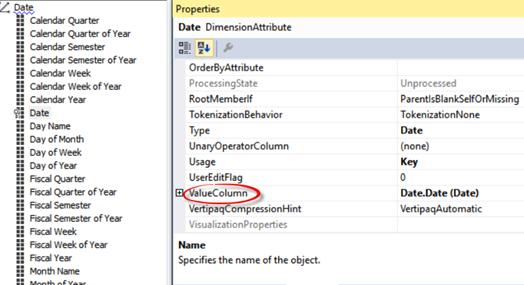
This requirement presents issues if the report is connected to a Multidimensional cube because by default all attributes are text-based. As a workaround, in the Multidimensional project set the ValueColumn property of the attribute to a column in the underlying table of a numeric or date data type, and deploy the cube.
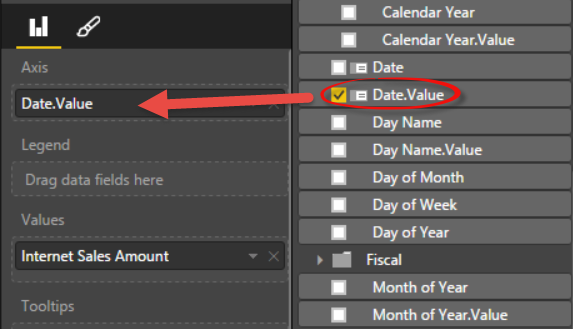
Back to Power BI Desktop, bind the corresponding .Value field to the X-axis.
https://prologika.com/wp-content/uploads/2016/01/logo.png00Prologika - Teo Lachevhttps://prologika.com/wp-content/uploads/2016/01/logo.pngPrologika - Teo Lachev2016-07-28 21:13:352016-07-28 21:13:35Trend Lines in Power BI Charts
Power BI is one-year old. it’s hard to imagine that one year has passed but here we are. The momentum behind Power BI is huge both from development and customer perspectives. It’s exiting to see a product that evolves so fast based on feedback from users. So, there will be many more birthdays. And for the nay sayers out there, no, Power BI is not immature as its building blocks (Power Pivot, Power Query, Power View, Tabular, Azure) have been around for many years.
Anyway, it’s time to recognize all the effort that went behind the new Power BI. Happy Birthday from the community!
MS BI fans, join me for the next Atlanta MS BI and Power BI Group meeting on July 25th at 6:30 PM. Shabnam Watson will teach you MDX fundamentals. Pyramid Analytics, our sponsor, will show us why they are Microsoft Power BI preferred vendor. And I’ll demo the Power BI Publisher for Excel.
MDX is an industry standard query language for OLAP systems and is used to query Microsoft Analysis Services (SSAS). Custom MDX queries can be authored in SQL Server Management Studio (SSMS), Reporting Services, Power BI and custom applications. While SQL and MDX share some common keywords, they have very different syntax and concepts. This session is for anyone familiar with SQL who wants to get started with MDX. In this session we will first explore data organization in SSAS in multidimensional mode using AdventureWorks sample database. Then we will review a couple of MDX and SQL queries that return the same results and continue to learn MDX fundamentals by running queries in SSMS. We will see how certain queries are much easier to write in MDX, especially when it comes to querying data with hierarchies such as a date rollup. Finally, we will learn how to capture MDX queries generated by Excel and SSMS, to use as practical examples of how to write MDX queries.
Speaker:
Shabnam Watson is an independent business intelligence consultant with 15 years of experience developing end-to-end data warehouse and business intelligence solutions using Microsoft technologies. She holds a master’s degree in computer science and a Certified Business Intelligence Professional (CBIP) certification by The Data Warehouse Institute (TDWI). She has worked with OLAP since SQL Server 7.0 and specializes in solving complex MDX and design challenges with Analysis Services.
Sponsor:
Pyramid Analytics is a global BI&A leader offering an analytics platform that helps companies compete as world-class data-driven organizations. Pyramid Analytics’ mature BI Office Version 6 is an enterprise business analytics platform that puts the power of analytics into the hands of every user across an organization, making it possible to model, discover, communicate and distribute data for better corporate decision making. Pyramid Analytics was again recognized in Gartner’s 2016 Magic Quadrant Business Intelligence and Analytics (BI&A) Platforms Report for BI Office’s capabilities as a balanced analytics platform with strong governance, metadata management, security, and user administration.
https://prologika.com/wp-content/uploads/2016/01/logo.png00Prologika - Teo Lachevhttps://prologika.com/wp-content/uploads/2016/01/logo.pngPrologika - Teo Lachev2016-07-24 19:22:402016-07-24 19:22:40Atlanta MS BI Group Meeting on July 25th
Have you looked at your BI spend recently? Sometimes, I’m puzzled by the enormous spending in “this is how we’ve always done it” initiatives that probably could be replaced and done much more efficiently with modern technology and cloud computing. I had a recent conversation with a Chief Analytical Officer of one of the US largest financial organizations. They have outsourced hosting of their 5 TB data warehouse to another company that charge them more than 100K per month. And this is just for hosting on a single SMP SQL Server with no fault tolerance and SLA in place!
Was he surprised to find that this data warehouse could be hosted in SQL Server Data Warehouse on Azure for well under 10K per month? Not to mention that besides x10 cost savings, they’ll get a Massive Parallel Processing (MPP) system on a par with Teradata and Netezza, with the ability to scale up and down with a click of a button? Further, the system will be fully fault tolerant with automatic back-ups. Add the flexibility that comes with moving to the cloud instead of being locked in a vendor that dictates what you should install and run? You’d be surprised how open to the cloud even financial companies might be after realizing these benefits. The same applies to customers who realize what they’re spending in overly expensive BI tools under the pretext that they are still “best in class”. They are not, trust me, and you’re being taking advantage of. It’s time to move on.
https://prologika.com/wp-content/uploads/2016/01/logo.png00Prologika - Teo Lachevhttps://prologika.com/wp-content/uploads/2016/01/logo.pngPrologika - Teo Lachev2016-07-24 19:13:062016-07-24 22:38:33Is Your BI Strategy Cost Effective?
I’m presenting in person “What’s New for BI in SQL Server 2016” for the SQL User Group in Birmingham, AL tomorrow, July 19th starting at 6 PM local time.
Join us Tuesday the 19th in Room 311 of Russell Hall on the Samford University campus for the July meeting of Steel City SQL. This meeting will feature MVP Teo Lachev presenting What’s New for BI in SQL Server 2016.
Food and beverages for this month’s meeting will be provided. If you plan on attending this month’s meeting let us know by registering at steelcitysqljul2016.eventbrite.com so we can plan accordingly. Hope to see you there. When
iCal UTC : Tue, Jul 19 2016 23:00 – 00:30 Event Time : Tue, Jul 19 2016 18:00 – 19:30 Central Daylight Time
Where
311 Russell Hall – Samford University Birmingham, Alabama
What’s New for BI in SQL Server 2016
Speaker: Teo Lachev, SQL Server MVP Prologika
Summary: SQL Server 2016 delivers many data analytics and information management new features and enhancements. Join this session to discover what’s new for BI in Database Engine, SSRS, SSIS, SSAS, and MDS. I’ll also explain the SQL Server 2016+ near-future roadmap that will help you implement new solutions and cut cost.
About Teo: Teo Lachev is a consultant, author, and mentor, with a focus on Microsoft Business Intelligence. Through his Atlanta-based company “Prologika”, a Microsoft Gold Partner in Data Analytics, he designs and implements innovative solutions that unlock the power of data and bring tremendous value to his customers, ranging from small companies to Fortune 50 organizations. Teo has authored and co-authored several SQL Server BI books and he has been leading the Atlanta Microsoft Business Intelligence group since he founded it in 2010. Microsoft has recognized Teo’s expertise and contributions to the technical community by awarding him the prestigious Microsoft Most Valuable Professional (MVP) award since 2004.
https://prologika.com/wp-content/uploads/2016/01/logo.png00Prologika - Teo Lachevhttps://prologika.com/wp-content/uploads/2016/01/logo.pngPrologika - Teo Lachev2016-07-18 21:03:512016-07-20 02:17:16Presenting for Steel City SQL User Group, Birmingham
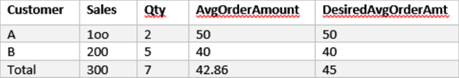
Sometimes, you might run into a scenario that requires an aggregate over an aggregate. Consider the following report:
The AvgOrderAmount has a simple calculation: SUM(Sales)/SUM(Qty). This calculation is applied uniformly. The Total line would divide 300/7 and will return 42.86. However, what is the user wants the result in the DesiredAvgOrderAmt column which produces a simple average over the details (50+40)/2. This could be accomplished by creating a base measure for the detail calculation:
HASONEVALUE would return TRUE when the calculation is performed at the detail level and FALSE in the “grand totals”. In the latter case, it performs a simple average over the detail aggregates. Think of it as performing a second pass over the details to produce an aggregate over aggregates.
https://prologika.com/wp-content/uploads/2016/01/logo.png00Prologika - Teo Lachevhttps://prologika.com/wp-content/uploads/2016/01/logo.pngPrologika - Teo Lachev2016-07-15 20:50:392016-07-15 20:56:02Aggregates over Aggregates in DAX
One great feature of Microsoft BI has been the continuum from personal BI to organizational BI. For example, a business user can start small with an Excel Power Pivot model which IT can restore at some point to a scalable Tabular model. In fact, if you know Microsoft personal BI (Power Pivot or Power BI Desktop), you already know 80% (or even more) of SSAS Tabular.
Unfortunately, currently there isn’t a supported way to restore Power BI Desktop models to Tabular or create a Tabular project from a pbix file. The reason is that because Power BI Desktop is changing on a monthly basis, it’s ahead of Tabular and currently Power BI Desktop doesn’t support backward compatibility. However, the following approach worked for me to upgrade Power BI Desktop to Tabular 2016.
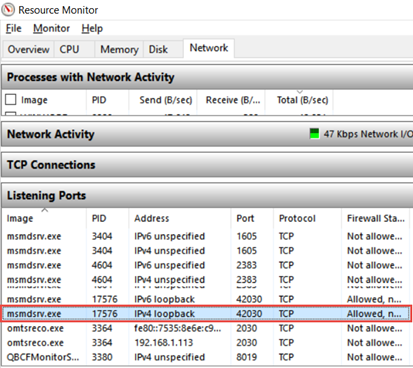
Power BI Desktop has a Tabular child process which is the workhorse for all data crunching you do on the desktop. This process uses a dynamic port. As a first step, you need to find that port. The easiest way to do so is to run Windows Resource Monitor (in the Windows search bar, type resmon). Then, flip to the Network tab, and in the Listing Ports section, find “msmdsrv.exe”, and then note the port number. In my case, I have a few instances of msmdsrv because I run dedicated instances of Multidimensional and Tabular but I found that the PBI Tabular instance ports start above 10000 so it should be easy to identify the instance.
Now that you have the port number, open SSMS 2016 (you can download it from here), and connect to that Tabular instance, using the syntax: localhost:<port number>. For example, to connect to the highlighted instance, in SSMS I’ll Connect ð Analysis Services, and then enter localhost:42030.
TIP: You can also use the SQL Profiler to connect to the PBI Tabular instance and do profiling using SQL Profiler, as Adam Saxton demonstrates here, or using DAX Studio, which by the way automatically enumerates the Power BI Desktop instances.
Right-click the database (the database name is a guid), and click Script ð Script Database As ð CREATE TO ð Clipboard. This will export the database schema in the new JSON format.
Connect to the Tabular instance that will host the database, and create a new Analysis Services XMLA Query, and paste the script. One of the changes you want to make here is to rename the database by change the name element at the beginning of the file so you don’t end up with the same guid for the database name.
Execute the script to create the new database. If you get an error, you should be able to change the script and strip code for features that Tabular doesn’t support. Now that we have JSON-based schema, making such changes should be much easier.
Now you can use SSDT to create a project by importing the Tabular database and continue making changes to the project.
https://prologika.com/wp-content/uploads/2016/01/logo.png00Prologika - Teo Lachevhttps://prologika.com/wp-content/uploads/2016/01/logo.pngPrologika - Teo Lachev2016-07-10 15:29:082016-07-15 20:53:46Upgrading Power BI Desktop Models to Tabular
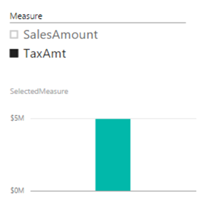
A large publicly-traded organization is currently standardizing on Power BI as a single BI platform as a replacement of Qlik and Tableau. They analysts have prepared a gap analysis of Power BI missing features. On the list was QlikSense variables. The idea is simple. The user is presented with a slicer that shows a list of measures. When the user selects a measure, all visualizations on the report dynamically rebind to that measure. For example, if SalesAmount is selected, all visualizations bound to the variable would show SalesAmount. However, if the user selects TaxAmt than this measure will be used.
As it stands, Power BI doesn’t have this feature but with some DAX knowledge, we can get it done by following these simple steps:
In Power BI Desktop, click Enter Data and create a table called Variable with a single column Measure. Here, I’m hardcoding the selections but they can come from a query of course. Enter the labels of the measures the user will see, such as SalesAmount, TaxAmt, one per row to populate the Measure table.
Create a new measure that has the following formula. Here I use the SWITCH function to avoid many nested IFs in case of many choices.
Add a slicer to you report that shows the Measure column from the Variable table.
Add visualizations to the report that use the SelectedMeasure measure. Now when you change the slicer, reports rebind to the selected measure.
An interesting progression of this scenario would be to allow the user to select multiple measures and adjust the formulas accordingly, such as to sum all selected measures. Another progression would be to change the list depending on who the user is (Power BI now supports data security!)