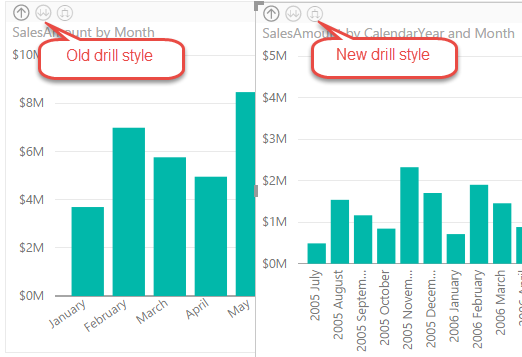
In the latest Power BI Desktop update, Power BI introduced a new drill-down option. Previously, after enabling drill-down on a chart and clicking the double-arrow icon, the chart will drill down to the next field in the Axis area (or to the next level of a hierarchy if a hierarchy is added to the Axis area). A student attending my Power BI class asked me this week how to avoid aggregation across all years if the user drills down from Year to the Month level. A few days ago, the only option was to introduce another Month field that has the Year-Month combination, e.g. 2005 July, 2005 August, and so on. Now, with the new drill down style, the chart will nest the hierarchical levels so you don’t have to add a new field. This behavior is similar to how Excel show categories nested in PivotChart.
MS BI fans, join me for the next must-attend Atlanta MS BI and Power BI Group meeting on September 26th at 6:30 PM. The Microsoft Ignite conference takes place this year in Atlanta, starting on Sep 26th. Kamal Hathi (General Manager for Power BI at Microsoft) and Pratap Ladhani (Sr. Program Manager at Microsoft) will be in town for Ignite and we will present at our meeting! This is a must attend session for everyone using or planning to use Power BI. Join us and learn why Power BI enjoys such a tremendous success and where Microsoft is planning to take it. Enjoy catering by Subway, thanks for Microsoft sponsoring this event.
Presentation:
Power BI at one year – a look back and a look forward
Level: Beginner
Date:
Monday, September 26th, 2016
Time
6:30 – 8:30 PM ET
Place:
South Terraces Building (Auditorium Room) 115 Perimeter Center Place Atlanta, GA 30346
Overview:
This is a must attend session for everyone using or planning to use Power BI. With weekly and monthly releases, there are a lot of fantastic new features to explore in Power BI. In this session we will cover an overview of what has been released in Power BI across PowerBI.com, Power BI Desktop, mobile apps and APIs. You’ll also discover what’s new and exciting in Power BI. In this session, we’ll also introduce PowerApps – a new product from the Power BI engineering team which enables non-developers to create & use custom applications & forms across all platforms (iOS, Android, Windows & Web).
Speaker:
Kamal Hathi is a General Manager for Power BI at Microsoft and a co-founder of Microsoft’s multi-billion dollar Analytics and Business Intelligence products. Kamal has delivered Power BI to market, and was responsible for its end-to-end strategy, design and delivery. Kamal is currently responsible for product growth and success of the Microsoft Business Application Platform.
Pratap Ladhani is a Sr. Program Manager at Microsoft focusing on Customer & Partner success for PowerApps and Microsoft Flow. He has been working with Microsoft for more than 13 years and has spoken earlier at Build, TechEd, Convergence & WPC conferences. We expect other speakers from Microsoft to join us too.
Sponsor:
Microsoft
https://prologika.com/wp-content/uploads/2016/01/logo.png00Prologika - Teo Lachevhttps://prologika.com/wp-content/uploads/2016/01/logo.pngPrologika - Teo Lachev2016-09-18 15:08:042016-09-18 15:17:22Atlanta MS BI Group Meeting on September 26th
One of the most prominent Power BI benefits is its extensible architecture that allows developers to integrate Power BI with custom apps and extend its capabilities, such by creating custom visuals. Having contributed one of the first custom visuals, the Sparkline custom visual, I can tell from experience that Microsoft does its part to ensure that the submitted visuals meets quality, security, and functionality best practices.
As custom visual developers have probably noticed, the Power BI Dev Tools is deprecated in favor of the new Custom Visual CLI Developer Toolset. The announcement page enumerates the main benefits of the new toolset. Personally, I like that Microsoft has decoupled the tool from dependencies to the “visual framework” that the original Power BI visuals use. This allows developers to use whatever dev tool they like, such as Visual Studio Code or Visual Studio, to code custom visuals. I also like the better integration with Power BI Service for auto-detecting code changes and showing what data has been passed to the visual.
There will be some pains when migrating existing visuals to the new tool. As of this time, there are also missing features so don’t rush yet to the new tool:
Tooltips are not yet supported.
Value formatters, such as to format values shown in tooltips, are not supported so you have to create your own, use third-party libraries, or copy code from this project.
The D3 definitions that the tool installs are different from the ones old tool and the Visual Studio framework used. Moreover, Microsoft indicates that they will stop providing the D3 definitions. Consequently, some D3 features I used resulted in compiled errors so I had to use the old types.
For some reason, checking the “Enable developer visual for testing” checkbox in Power BI Settings didn’t “stick” for me in Chrome so I had to use Edge.
The new Custom Visual CLI Developer Toolset will improve the developer experience for coding custom visuals. Download the migrated Sparkline code that works with the new toolset to understand the changes.
Organizations are showing increased interest in predictive analytics. A large retailer that is using Azure Machine Learning (or AzureML) has approached me to help them automate the process. I can’t help it but compare AzureML with the Analysis Service Data Mining each time I look at it. It looks like both Microsoft and I agree at this point, that what used to be difficult was made simple and vice versa. On the upside, AzureML provides business users with a cloud environment for creating predictive solutions without involvement from IT. AzureML has more features than SSAS Data Mining. Now that the focus is on the cloud, we probably won’t see future investments from Microsoft in SSAS Data Mining (and the Excel data mining add-in for that matter) which is currently limited to nine algorithms. By contrast, not only has AzureML many more algorithms but also it allows users to use R and Python, create workflows, and enjoys a vibrant community that is eager to contribute samples. So, AzureML to predictive analytics is what Power BI is to descriptive analytics. It’s all about democratizing analytics to anyone who needs it.
On the downside, operationalizing AzureML predictive experiments has left some room for improvement. True, it’s very easy to promote your experiment as a web service that can be called in a singleton (one row at the time) or batch manner. The Excel Azure Machine Learning Add-in makes it easy to call the service as singleton or batch if your data lives in Excel and user interaction is acceptable. The Chapter 10 source code of my Applied Power BI book demonstrates how a Power BI model can call a predictive service as singleton and the steps are explained in the book. However, automating this process is much more difficult. Previously, all it was required to periodically retrain an SSAS data mining model was to schedule a job with the SQL Server Agent. By contrast, simply scheduling an AzureML experiment for retraining is currently not an option. You need to integrate with the experiment’s web service either programmatically or by using Azure Data Factory. Similarly, scoring the model in a batch mode (instead of singleton execution), requires calling the batch web service endpoint. Consequently, this requires either custom code (see the Microsoft Azure Machine Learning Samples on CodePlex) or using an Azure Data Factory pipeline. Either of these scenarios would require an intervention from your fellow programmer or Azure Data Factory expert. By contrast, SSAS data mining models can be queried with DMX which is easy but promoting them to the outside world requires custom coding.
Here is a diagram of an Azure Data Factory pipeline that I implemented to demonstrate scoring an AzureML model in a batch execution mode using data from a stored procedure residing in an on-premises SQL Server. In this case, my AzureML predictive experiment returns the probability of a customer to purchase a product although what the experiment does is irrelevant as far automation is concerned.
The high-level steps to automate the process are:
Create a NewCustomers dataset (table) that represents the output of the stored procedure for the new customers that you’ll predict on. Because in this case we’re sourcing data from an on-premises server, we have to install (you guess it) a Data Management Gateway, which you can download from your Azure Data Factory service in the Azure portal. As of now, this gateway is not the same as the Power BI Gateway that is used also by PowerApps, Microsoft Flow and Azure Logic Apps, mind you.
Because the predictive batch service requires an input, use the Copy Activity (blessed be the ADF team for adding it!) to save the results of the stored procedure to Azure Storage as an CSV file with headers.
Use the AzureMLBatchExecution activity to pass the file to the batch endpoint of the predictive experiment.
Save the predicted results from the predictive service as a file in Azure Storage and do whatever is needed with the results.
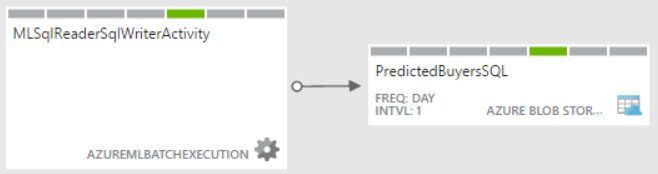
If the experiment gets the input data from Import Data (formerly known as a Reader), such as from on-premises or Azure SQL table, you can simplify scoring and retraining the model by creating a simple Azure Data Factory pipeline that has only the AzureMLBatchExecution activity. In this case, the activity passes no input to the web service and if the experiment writes to a database, no output is needed either. However, because the pipeline definition requires an output, I still had to create a dummy Azure Storage dataset (PredictedBuyersSQL) although not files will be sent to it.
Here is what the simplified ADF pipeline may look when the experiment reads and writes to a database.
AzureML will play an increasingly important role with predictive analytics on the rise. I hope the next release of AzureML would simplify operationalizing predictive experiments so that it doesn’t require programming effort or involvement from IT. Now that AzureML supports importing data from on-premises SQL Server and other cloud data sources, it should be simple to automate retraining and scoring models.
https://prologika.com/wp-content/uploads/2016/01/logo.png00Prologika - Teo Lachevhttps://prologika.com/wp-content/uploads/2016/01/logo.pngPrologika - Teo Lachev2016-09-09 16:04:322016-09-21 22:16:54AzureML – Current State of Affairs
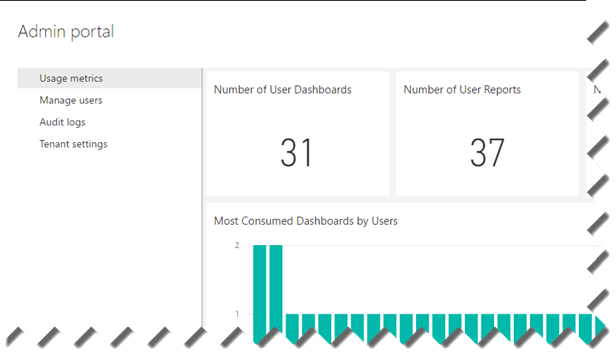
Larger organizations are naturally interested in established procedures for data governance, retention, search and taxonomy. With the rising important of data analytics, such policies are equally important for BI artifacts. For example, a large organization wants to restrict users to access Power BI only from approved devices and/ or on premises. Although it doesn’t match yet the SharePoint data governance features, Power BI is making strides in this direction. The tenant admin can access the Admin Portal page (log in to powerbi.com, then click Settings, Admin Portal) to:
View Power BI usage metrics and utilization. This fulfills a similar role to the Power Pivot Management Dashboard in SharePoint.
Manage users.
Set global tenant permissions, such as the ability to publish content pack to the entire organization, allowing sharing content with external users, publish to web (anonymous access), export data, interact with R scripts, Cortana, Analyze in Excel, templates, create audit logs, and data classification.
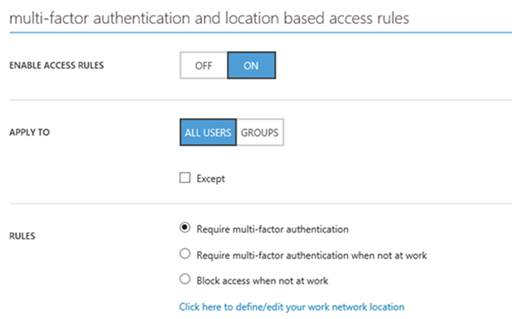
Recently, Power BI added two very important governance features:
Active Directory conditional policies (requires Azure Active Directory Premium) – Enforces multi-factor authentication that adds an additional-level of the login process, besides using his email and password, the user has to enter a code that Power BI sends to a mobile device. The “Block access when not at work” rule prevents the user from accessing Power BI while not at work.
Auditing– When enabled, this feature generates audit logs when users access Power BI content, export data, or make changes to important settings. Although the tenant admin needs to access the Office 365 Security and Compliance Portal to view the logs, auditing doesn’t require Office 365 subscription.
Last week’s seminar on formulating a Power BI enterprise strategy held at the Microsoft office was a great success. Over 50 people witnessed the amazing capabilities of the Power BI platform. As Power BI evolves, we’ll have similar events to bring you up to date. If you couldn’t attend, you can find the slides here. Or, are you looking for more in-depth Power BI training? There is still time to register for my 2-day public Power BI workshop on Sep 14-15 at the Microsoft Office in Atlanta. Reserve your seat today to attend this exclusive event for only $999 and learn practical Power BI knowledge and data analytics skills that you can immediately apply to your job.
Speaking of Power BI, do you need to embed reports in custom apps in order to bring data analytics to your customers? If so, look no further than Power BI Embedded, which Prologika has been using to help ISVs increase the value of their apps by bringing instant insights to their customers. Most applications need some reporting capabilities. Report-enabling custom applications has been traditionally challenging with the Microsoft BI platform. True, Visual Studio includes Windows Forms and ASP.NET ReportViewer controls that make it very easy to embed Reporting Services reports (also known as paginated reports). However, the chances are that you might prefer more interactive reports that can be viewed with any browser and on any device. This is where Power BI Embedded comes in. You have the app. You have the data. Now bring data to life inside your app with Power BI Embedded!
What’s Power BI Embedded?
Power BI Embedded is an Azure cloud service that help developers embed Power BI interactive reports in custom apps for a third party. Notice that I said “third party”. The current licensing model prevents you for using Power BI Embedded to distribute reports inside your organization or re-implement functionality that already exists in Power BI. Fair enough – internal users are already covered by Power BI licenses and Microsoft doesn’t want you to come up with a tool that competes with Power BI. Speaking about licensing, what’s great about the Power BI Embedded pricing model is the recent change that Microsoft made where you’re charged per a report session and not for the number of reports that are rendered or registered customers! When the user opens a report, a session is started for one hour or until the user closes the app. The first 100 sessions/mo are on Microsoft. After that you’re charged $5 for 100 sessions per month. Besides the Power BI Embedded great features, this cost-effective pricing model is why independent software vendors (ISVs) and developers are flocking to Power BI Embedded.
How are users provisioned?
If you recall, Power BI requires each user to sign up. Power BI Pro charges the user $9.99 per month (based on feedback from customers, they don’t pay the sticker price because they either acquire Power BI through the Office 365 E5 plan and/or have a discounted price). If you have an app that potentially can be accessed by thousands of users, the Power BI pricing model is not cost effective. By contrast, Power BI Embedded leaves it up to the custom app to authenticate the user. So there is no provisioning you have do. However, although Power BI Embedded uses the Power BI infrastructure, don’t expect the Power BI reports to show up when you log in to Power BI. In other words, Power BI Embedded and Power BI don’t share datasets and reports. Consequently, at the least for now, Power BI Embedded is limited to embedding reports only. No Q&A, no quick insights, no portal, and no other Power BI goodies. Another limitation is that at least for now Power BI Embedded is limited to report viewing only. Users can’t edit the reports, such as to add or remove fields.
What data sources are supported?
One what to acquire data is to import your data in Power BI Desktop. When you import data, you’re limited of 1 GB of compressed data, which is the same dataset limitation that Power BI currently has. Because of the excellent compression (x5-10 ration), you can still pack a lot of data into a 1 GB dataset. For example, you can create a separate extract for each customer if you have a limited number of customers or you need to provide a high degree of customization for each customer. Another option is to connect live to cloud data sources. Because Power BI Embedded is an Azure cloud service, naturally it works with Azure-resident PaaS data sources, such as Azure SQL Database and Azure SQL Data Warehouse.
How does security work?
Power BI Embedded uses OAuth to authorize your users with Power BI. Your application authenticates the user as it would normally do. If the user has access to reports, your application would login to the Power BI Embedded using a special access key (think of it as a password). When the user requests the report, the application generates a token that Power BI validates to grant access to the report. If you need to support row-level security (RLS), Power BI Embedded get you covered too! You can define your security roles and row filters in Power BI Desktop. Then, your application can pass the user login (it doesn’t have to be on your domain) and what role(s) the user belongs to. The net result is that the user can see only the data the user is authorized to see.
How customizable is Power BI Embedded?
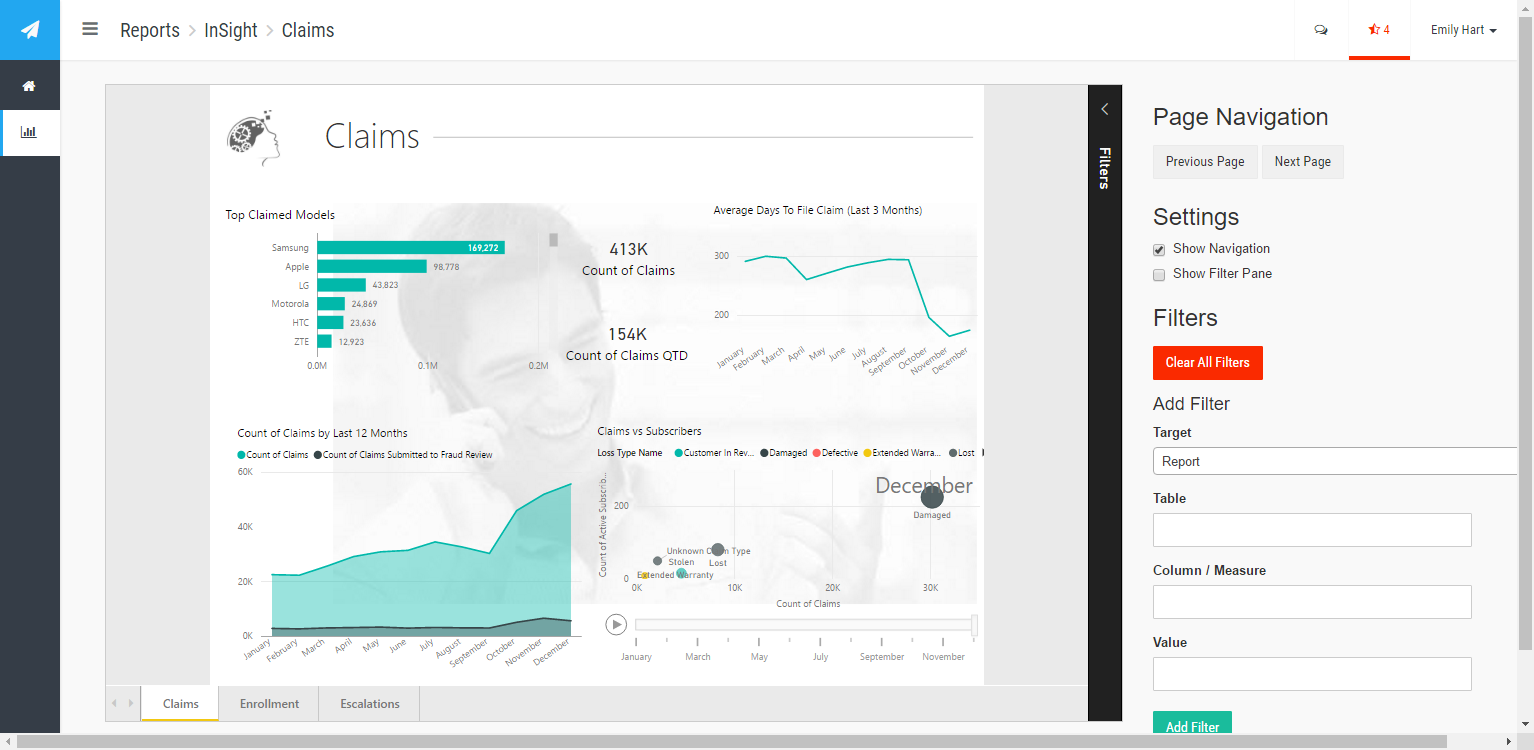
The Power BI Embedded customization story got even better with the introduction of the JavaScript APIs. They allow you to programmatically access the report object model on the client, such as to react to page change events, pass filters, or hide the report filter pane. For example, in the screenshot above, the application has its own page navigation and filter pane that replaces the Microsoft-provided filter pane. This gives the application more control about validating and passing visual, page, or report-level filters.
How do I get started?
Microsoft has provided an excellent ASP MVC sample to get you started. Check also my “Configuring Power BI Embedded” blog for a better configuration experience
Atlanta Code Camp 2016: A free training event for developers on October 15th. I’ll have a presentation on Power BI Embedded.
As you’d probably agree, the BI landscape is fast-moving and it might be overwhelming. If you need any help with planning and implementing your next-generation BI solution, don’t hesitate to contact me. As a Microsoft Gold Partner and premier BI firm, you can trust us to help you plan and implement your data analytics projects, and rest assured that you’ll get the best service.
Regards,
Teo Lachev Prologika, LLC | Making Sense of Data Microsoft Partner | Gold Data Analytics


 Last week’s seminar on formulating a Power BI enterprise strategy held at the Microsoft office was a great success. Over 50 people witnessed the amazing capabilities of the Power BI platform. As Power BI evolves, we’ll have similar events to bring you up to date. If you couldn’t attend, you can find the slides