I’m excited to announce the third edition of my Applied Microsoft Power BI book! When the original book was published in January 2016, it was the first Power BI book at that time. Since then, I helped many companies adopt or transition to Power BI, and taught hundreds of students. It’s been a great experience to witness the momentum surrounding Power BI.
The third revision added more than 20% new content (the book is now 426 pages) and probably that much content was rewritten to keep the book up with the ever-changing world of Power BI. Because I had to draw a line somewhere, Applied Microsoft Power BI (3nd edition) covers all features that were that were released by early December 2017. As with my previous books, I’m committed to help my readers with book-related questions and welcome all feedback on the book discussion forum on the book page. While you are there, feel free to check out the book resources (sample chapter, front matter, and more). I also encourage you to follow my blog at https://prologika.com/blog and subscribing to my newsletter at https://prologika.com to stay on the Power BI latest.
Bring your data to life for a third time! Keep on reading and Happy New Year!
https://prologika.com/wp-content/uploads/2016/01/logo.png00Prologika - Teo Lachevhttps://prologika.com/wp-content/uploads/2016/01/logo.pngPrologika - Teo Lachev2017-12-31 11:08:382021-02-17 01:01:52Applied Power BI Book (3rd Edition)
Introduces information workers, data analysts, IT pros, and developers to Microsoft Power BI — a cloud-hosted, business intelligence and analytics platform that democratizes and opens BI to everyone, making it free to get started!
Power BI changes the way you gain insights from data; it brings you a cloud-hosted, business intelligence and analytics platform that democratizes and opens BI to everyone. It does so under a simple promise: “five seconds to sign up, five minutes to wow!”
“That is why resources like this fantastic book will become instrumental for you!” Jen Underwood Principal Program Manager Microsoft Business Intelligence
Synopsis
An insightful tour that provides an authoritative yet independent view of this exciting technology, this guide introduces Microsoft Power BI—a cloud-hosted, business intelligence and analytics platform that democratizes and opens BI to everyone, making it free to get started!
Information Workers will learn how to connect to popular cloud services to derive instant insights, create interactive reports and dashboards, and view them in the browser and on the go! Data Analysts will discover how to integrate and transform data from virtually everywhere and then implement sophisticated self-service models. The book also teaches BI and IT Pros how to establish a trustworthy environment that promotes collaboration, and they’ll implement Power BI-centric solutions for descriptive, real-time, and predictive analytics. Developers will find out how to integrate custom applications with Power BI, to embed reports, and to implement custom visuals to effectively present any data.
Ideal for both experienced BI practitioners and beginners, this book doesn’t assume you have any prior data analytics experience. It’s designed as an easy-to-follow guide that introduces new concepts with step-by-step instructions and hands-on exercises.
What’s inside
Get insights from popular cloud services on any device!
Implement sophisticated personal BI models!
Enable team BI and implement descriptive, predictive, and real-time BI solutions!
Extend Power BI with custom visuals and report-enable custom apps! …and much more!
“The true power in Power BI cannot be appreciated without understanding what the offering can do and how to best use it. That is why resources like this fantastic book will become instrumental for you. This book starts by providing an overview of the foundational components of Power BI. It introduces Power BI Desktop, data modeling concepts, building reports, publishing and designing dashboards. Readers will be up and running in no time. It then moves on to bring you up to speed on deeper dive topics such as data gateways, data re-fresh, streaming analytics, embedding and the Power BI data visualization API. Not only is Teo one of the first people in the world to learn and write about Power BI 2.0, he also brings a wealth of knowledge from deploying the first real-world implementations. Much like Teo’s previous books on Analysis Services and Reporting Services, this Power BI book will be a must read for serious Microsoft professionals. It will also empower data analysts and enthusiasts everywhere.”
Jen Underwood Principal Program Manager, Microsoft Business Intelligence
“I’m impressed about the breadth of the topics covered by Teo Lachev in this book, I’ve just took a quick look at every chapter, and Teo covered all the topics at least at the point where you can start doing something (and in some chapter also more than just an intro). Considering the speed of Power BI releases and the effort required in writing a book, I know the huge effort behind this. My kudos to this book!”
Buy the paper copy from Amazon Buy the Kindle ebook from Amazon
https://prologika.com/wp-content/uploads/2016/01/apbi2.png301229Prologika - Teo Lachevhttps://prologika.com/wp-content/uploads/2016/01/logo.pngPrologika - Teo Lachev2017-12-24 14:30:072021-02-17 01:00:56APPLIED MICROSOFT POWER BI (2nd Edition) (BRING YOUR DATA TO LIFE!)
Happy Holidays! I hope you’re enjoying this special time of the year – time for sharing and giving. Speaking of sharing, how does your company share BI artifacts with your B2B or B2C partners? Do you still send Excel spreadsheets or embed canned SSRS reports? If so, Power BI offers a better sharing model and I’ll show you how in this letter. And about Power BI, I’m proud to announce that the third revision of my “Applied Power BI Book” should be out in a week or so. Thoroughly updated to reflect the latest of the ever-changing cloud world of Power BI and featuring 20% new content, this book is the self-study resource your organization needs to master Power BI.
Sharing in Power BI Service
Many organizations share reports with external users for Business to Business (B2B) or Business to Consumer (B2C) scenarios. If all you need is granting some external users access to some cool interactive reports and dashboards inside powerbi.com, you can do so by just sharing the content out using dashboard sharing or apps, as you do with internal users. But there are some special considerations though so read on.
Like using Power BI for internal use, external users need to be authenticated by a trusted authority. To authenticate external users, Power BI relies on Azure Active Directory (AAD). Therefore, the external organization and user need a record in AAD. If the user doesn’t have an AAD account, the user will be prompted to create one. Let’s say Elena from Adventure Works wants to grant Matthew from Prologika access to some Power BI content. Elena creates a workspace to host the external content and then she invites Matthew. To do so, she can simply share a dashboard or create an app, and then add Matthew’s email as a recipient. Matthew receives an invitation email with a link to the dashboard or app. Matthew clicks the link to access the content. Azure AAD verifies that Prologika and Matthew have records in AAD. If so, AAD will ask Matthew to sign in with his AAD credentials and grant him access to the shared Power BI content.
About cost, Power BI licensing for external users is not much different from licensing internal users. In a nutshell, the external user must have a Power BI Pro license to access Power BI content in the sharing tenant. This license can be acquired in one of three ways:
The sharing organization is on Power BI Premium – If Adventure Works is on Power BI Premium and the sharing workspace is in a premium capacity, Elena can share content to external users, just like she can share content with internal Power BI Free users.
The sharing organization assigns Power BI Pro licenses – Elena can assign one of her organization’s Power BI Pro licenses to Matthew.
The external organization assigns Power BI Pro licenses – In this case, Matthew has a Power BI Pro license from the Prologika’s Power BI tenant. Matthew can bring in his license to all organizations that share content with Prologika.
Sharing with Power BI Embedded
Sharing in Power BI Service is simple, but it has some important drawbacks:
Dependency on Azure Active Directory (AAD) – Every user must have an AAD account.
Not adequate support for B2C – AAD is expected to support Live IDs soon, such as outlook.com emails, but you’d need to wait for other providers. Yet, many B2C apps allow external customers to authenticate with email addresses of their choice. UPDATE 3/11/2018:Power BI Service now supports sharing using personal emails.
Per-user license – Despite that Power BI offers three licensing options for external users, every user must be covered by a Power BI Pro license.
Read-only reports – Users are limited to read-only reports. They can change existing reports or create new reports.
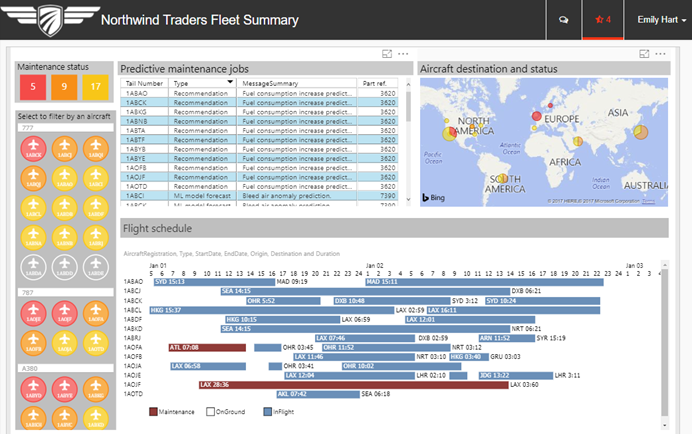
Collectively known as Power BI Embedded, the Power BI embedded APIs can help your developers overcome these challenges in a cost-effective way. A developer can integrate any modern web-enabled app to embed Power BI dashboards, reports, and even natural questions, so that they appear as a part of your company’s offering (see the screenshot below), instead of redirecting the user to powerbi.com. Reports not only preserve their interactive features, but also users can edit them or create new reports from scratch (if your app lets them)!
There are two ways to acquire Power BI Embedded. If your organization is on Power BI Premium, you already have everything you need to embed content for both internal and external users (assuming a P plan as EM plans are more restrictive and for embedding only). Most smaller companies and Independent Software Vendors (ISVs) looking for embedding content to external users only, would gravitate toward the Azure Power BI Embedded plans. Starting at $750/month, there are currently six Azure plans depending on how much capacity (memory, cores, and report views) you need. The Azure plans can also result in significant cost savings because they allow you to quickly scale up and down, and even pause them! For example, if the most report activity happens within normal working hours, you can scale it down to a lower plan outside the peak period.
Have you used Power BI Embedded before? When Microsoft introduced Power BI Premium in June 2017, they also revamped Power BI Embedded. Previously, Power BI Embedded was for embedding content for external users only. It was implemented as a Microsoft Azure Service and it had its own content storage and different APIs. The problem was that the old Power BI Embedded didn’t have feature parity with Power BI Service. This all changed with the new Power BI Embedded. Think of the new Power BI Embedded as Power BI Service with its own licensing model that has the same features as Power BI Service. The old Power BI Embedded will be discontinued in mid-2018, so it’s time to migrate and modernize your apps.
Power BI Embedded can deliver tremendous value to your business partners by bringing the powerbi.com engaging experience but embedded in your portals and apps. If you need implementation help with Power BI Embedded, drop us an email at https://prologika.com/contact/. Prologika has successfully helped a few organizations integrate their apps with Power BI Embedded. Learn about the business value from one of our engagements in the Microsoft’s “ZynBit Empowers Sales with Microsoft Power BI Embedded” case study.
As you’d probably agree, the BI landscape is fast-moving and it might be overwhelming. If you need any help with planning and implementing your next-generation BI solution, don’t hesitate to contact me. As a Microsoft Gold Partner and premier BI firm, you can trust us to help you plan and implement your data analytics projects, and rest assured that you’ll get the best service. Regards,
Teo Lachev
Teo Lachev President and Owner Prologika, LLC | Making Sense of Data Microsoft Partner | Gold Data Analytics
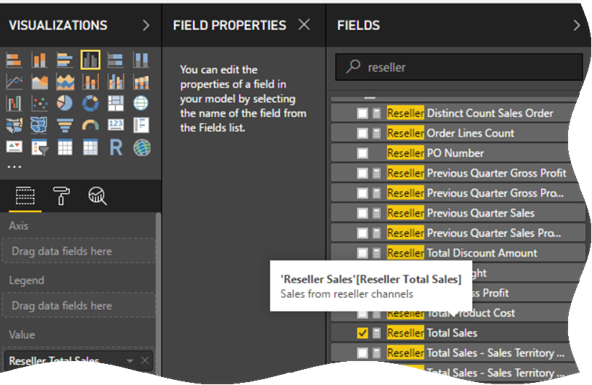
I’m a big fan of self-documented semantic models. Business users have a hard time getting their way around complex models and descriptions can go a long explaining the purpose of metadata. After waiting for years for Excel to support field descriptions (the wait is still on), the December update of Power BI Desktop now supports them.
The new Field Properties window lets you enter descriptions for self-service data models. When connecting to Analysis Services, descriptions just light up on hover. A true Christmas gift! And Q&A in Power BI Desktop makes it ever better.
https://prologika.com/wp-content/uploads/2016/01/logo.png00Prologika - Teo Lachevhttps://prologika.com/wp-content/uploads/2016/01/logo.pngPrologika - Teo Lachev2017-12-11 22:17:162017-12-11 22:17:16Field Description Support in Power BI Desktop
Feeling the heat, Tableau has come up with an updated Power BI vs. Tableau battle card as one of my clients pointed out. This time designed as a video. I guess the previous “10 Ways Power BI Falls Short” slide deck, which I discussed in the part 1 and part 2 of my “Power BI vs. Tableau” blog , wasn’t effective enough. I concur given the large number of customers abandoning the tool. Tableau is desperately trying to breathe new life into their aging software by a series of acquisitions to stay competitive but they’re now fighting an uphill battle. And their marketing materials should have a timestamp because Power BI improves every month and points get outdated quickly (see the first part 1 of my blog).
But let’s take a look at the latest battle card so we are better positioned to answer the question asked by Tableau “Which one helped me answer my questions faster?”
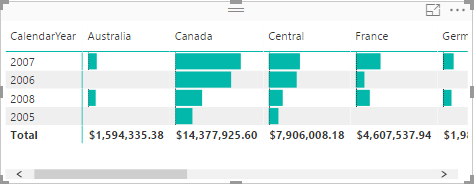
2:17 minute – Tableau shows a bar multiple by Year and Region, with the narrative “it’s surprising that other tools can’t do that”. Here is a similar visual with Power BI.
4:00 minute – Maps. OK, Tableau is very excited about lassoing points on the map like it’s the Holy Grail of geospatial analytics. What about other features that in my opinion are more important, such as using authoritative spatial data, like ArcGIS? Because Tableau its proprietary visualization framework that doesn’t natively support plugins, this is what you have to do to get it with Tableau integrated with ArcGIS. With Power BI, it’s built in a custom visual, which by the way supports lassoing. So, which one helped me answer my questions faster?
5:30 minute — The high-density outlier pitch. Alas, this time isn’t taking the central stage. As explained here, as of 9/30 all Power BI visuals except maps are high density so it’s a mute point. UPDATE 1/8/2017: As of the December 2017 update of Power BI, maps are high-density too.
7:11 minute – Tableau pitches that the tool can connect to lots of, lots of data but shows less connectors than Power BI. Power BI has 80 connectors and more are added every month.
8:00 minute – Tableau discusses collaboration and how easy it should be to share with coworkers by deploying to on-premises Tableau server. Well, I’d argue that it’s easier to deploy to the cloud, or even better, give the user the choice to deploy to a PaaS platform or to on-premises server. I also find it amusing that a tool that was once considered a “gold standard” for data visualization has run out of visualization strengths, and harps on collaboration from this point on.
10:00 minute – I’m losing the pitch as Tableau is demonstrating how dashboards have full fidelity when published. So, do Power BI reports.
11:00 minute – Recipients personalizing shared reports and dashboards by creating views. Tableau has a point here, the Power BI sharing story needs consistency. Previously, organizational content packs allowed users to create personal read-write copies but apps, which supersede content packs, don’t have this feature (they are read-only to the recipient). About filtering, users can pass filters on the report URL. And users can create reports from scratch if they have access to the dataset, such as members of a workspace.
13:12 minute – Sandboxing and lifecycle management. The current Power BI Service story is to use workspaces for different environments, but Power BI Premium would most likely improve on this. On premises, you can use DEV and QA report servers which don’t require licensing. Try to get a free server with Tableau for QA/DEV!
14:00 minute – Auditing. Power BI supports usage metrics on report and dashboard level. Power BI also has comprehensive and integrated auditing with Office 365.
15:00 minute – More pitch about the Tableau Server governance. Well, SSRS/Power BI Report Server had this for a long time. But it also supports SSRS traditional reports, Excel reports, and Power BI reports. Speaking of a centralized report management, can you deploy anything else than Tableau reports to the Tableau report server, so it becomes an enterprise report portal for different report types?
16:00 minute – More about auditing. SSRS/Power BI Report Server has an execution log for this.
Then at the bottom of the page, we have a study by someone ex-Gartner, citing lower TCO for Tableau compared to Power BI. I can’t be reading this right. From the Gartner’s 2017 Magic Quadrant for Business Intelligence and Analytics Platforms, “On an annualized basis, Microsoft Power BI is roughly one-third of the license cost of a three-year perpetual BI license, but 80% lower than other cloud BI products. Low total cost of ownership was cited as the second most important reason for reference customers choosing Microsoft Power BI.” Yet, this researcher has found that “Microsoft Power BI’s total cost of ownership (TCO) to be 29% higher than Tableau”? Pick who to trust. And should business users deal with 20 GB datasets to start with? What about the novel idea of putting all of this data into a centralized semantic layer so we don’t have datasets moving around? Wait, isn’t a Tableau model limited to a single dataset with “data blending” capabilities? What’s the TOC then for all these isolated Tableau spreadmarts?
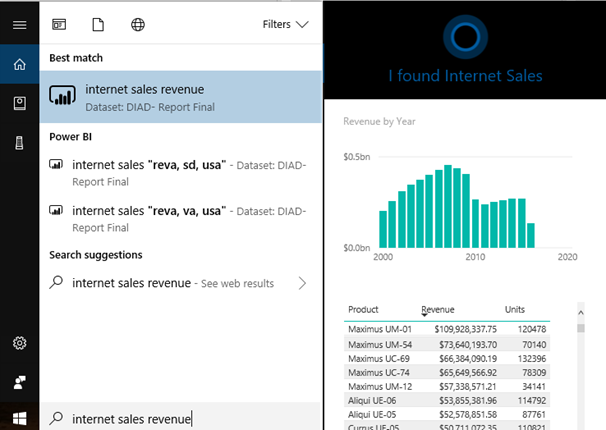
A Power BI presentation is rarely complete if someone doesn’t ask me to demonstrate the Cortana integration. However, unlike everything else in Power BI that gains features in time, in my opinion the Cortana experience has lost some value. Previously, you could ask natural questions in Cortana across datasets, just like you can use the Power BI Service Q&A to gain insights from dashboards. Unfortunately, Microsoft has removed this feature in favor of searching for report pages that are specifically optimized for Cortana (also known as Cortana answer cards). You can also search dashboards and reports by name but that won’t get you the “vow” effect since 1) you need to know the name and 2) when you click the name Cortana opens Power BI in a separate browser window. So much about natural queries and machine learning. I think the change took place after Microsoft decided to move away from Cortana natural queries to Microsoft’s Azure Search Service.
UPDATE 11/7/2017: I’ve heard from Microsoft about the Cortana change. Previously, you could ask natural questions in Cortana across datasets, just like you can use the Power BI Service Q&A to gain insights from dashboards. However, Microsoft noticed there were a large percentage of cases where customers were enabling Q&A in Cortana simply to search for reports, without intending to ask natural questions. This was resulting in unexpected Q&A ad-hoc results showing up in Cortana answer lists, leading to user confusion. So, Microsoft decided it would be better to restrict results to Cortana answer cards until Power BI supports configuration settings to allow model authors to explicitly control whether ad-hoc answers should be enabled as well.
Back to the Cortana answer cards, they appear to work only for datasets created in Power BI Desktop. They don’t work with the Power BI samples, nor they work in reports connected to dataset created directly in Power BI Service (e.g. by importing an Excel file).
Nevertheless, with the rising popularity of voice technologies (Alexa, Siri, Cortana), you’d probably still get the “vow” effect. And, even better, the reports are now interactive!
https://prologika.com/wp-content/uploads/2016/01/logo.png00Prologika - Teo Lachevhttps://prologika.com/wp-content/uploads/2016/01/logo.pngPrologika - Teo Lachev2017-11-06 17:22:162017-11-07 14:50:55Hey Cortana, where is Power BI data?
Scenario: You have published a Power BI Desktop file with a report to Power BI Service. You want to give certain users access to some pages in the report. This is not a security mechanism although it could be, if you want to control security at the report layer.
Solution: When a customer asked about this scenario, my first thought was to create reports directly in Power BI Service. For example, the report that’s included in the Power BI Desktop file could have some visuals that you might want to share with everyone. Then, you create additional reports for each group of users and share them via dashboard sharing. This approach will work but if someone nukes the dataset, your reports go down with it. True, you can export a report connected to a dataset created in Power BI Desktop but who bothers to back up reports on a regular basis?
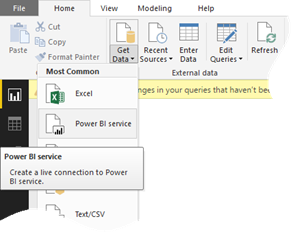
Then it dawned on me that you can connect Power BI Desktop live to a published dataset, just like you can connect to Analysis Services (recall that datasets published to Power BI Service are hosted in Tabular).
The major benefit of using Get Data->Power BI Service is that you can still back up the Power BI Desktop file and your reports with it.
Another benefit is that you can treat the published dataset as a “semantic layer” and let users create reports from it without importing data. For example, instead of asking users to call a stored procedure passing parameters and importing data, you can export all the required data and publish it to Power BI Service. Then, all users have to do is to connect to the dataset and start creating reports.
https://prologika.com/wp-content/uploads/2016/01/logo.png00Prologika - Teo Lachevhttps://prologika.com/wp-content/uploads/2016/01/logo.pngPrologika - Teo Lachev2017-11-05 18:59:522017-11-06 11:44:49Power BI Service in Get Data
Issue: You have a parameterized SQL Stored procedure that you want to call in DirectQuery mode. You attempt to use “exec sp parameter” syntax in the Power BI Desktop which works in the Query Editor but it fails to execute due to syntax error when you apply changes.
Workaround: Power BI uses the “select * from exec sp” syntax which doesn’t work. However, if you switch to OpenRowset (you’d need to enable ad hoc distribution queries on the database first), it will work. Other possible workarounds that would probably work is inserting the stored procedure results into a temp table and then select from the table, or wrapping the stored procedure with user-defined table function.
I attach a sample that demonstrates the OpenRowset approach. Download the Stored Procedure Direct Query.zip file (link provided at the end of this post) and rename the from *.zip to *.pbix.
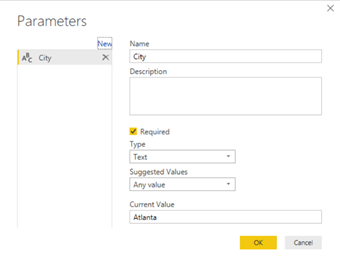
I went one step further and parameterized the stored procedure parameter so that your users can set it conveniently using Edit Queries -> Edit Parameters.
As I explained here, Power BI introduced the highly anticipated Quick Measures feature to avoid writing DAX formula for common measures. The feature is still in preview, so make sure you enable it in Power BI Desktop from File, Options and Settings, Options, Preview Features. Many quick measures, such as time intelligence calculations (YTD, QTD, Period Over Period Change, etc.), rely on a date field. The date field could come from a Power BI-provided date hierarchy or a Date table.
Letting Power BI auto-generate date hierarchies is easy but dangerous and limiting. As Chris Webb explains here, Power BI-provided hierarchies could bloat the size of the data model. For example, by disabling them in data in a data model provided by a customer, I was able to reduce the data model size from 300 MB to 30 MB!
Instead, a best practice is to have a Date table. It gives you a control over what date periods you want to include. It also allows you to analyze several fact tables by date in a single visual.
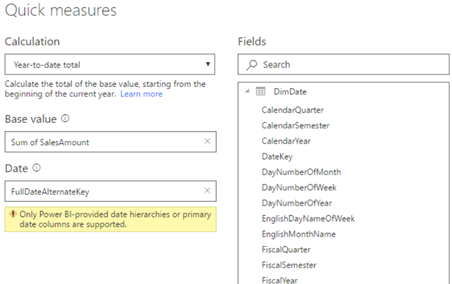
Unfortunately, unlike Power Pivot or Tabular, currently you can’t mark a Date table in Power BI Desktop, even though everything is configured correctly in your model. Attempting to use a date field from a Date table when setting up a quick measure, results in this error.
A “primary date column” means a field of a Date type in a Date table marked as such. DAX time intelligence functions only work when several conditions are met by the date column, such as must be at date granularity, must be continuous, cannot have duplicate values, etc. Since PowerBI hasn’t verified that a user supplied date column meets all those conditions, it doesn’t allow users to define Quick Measures to prevent unexpected results if user is unaware that they cannot just pick any date column.
So why the teaser then? A primary date column will work if you import a model with marked Date table from Power Pivot or if you connect to Tabular. While waiting for Power BI to let us mark Date tables, the workaround is to use a Power BI-provided hierarchy (at least to get the formula), and then change the formula manually to reference the Date field in your Date table. For an example of how to do this, refer to my blog that I mentioned at the beginning. Just don’t give up on data tables!
https://prologika.com/wp-content/uploads/2016/01/logo.png00Prologika - Teo Lachevhttps://prologika.com/wp-content/uploads/2016/01/logo.pngPrologika - Teo Lachev2017-10-22 20:10:202017-10-22 20:10:20Understanding Dates in Power BI Quick Measures
So far, Power BI has lacked the ability to navigate to particular report element, such as another report page, and to allow you to show/hide visuals. For example, Tableau allows you to add buttons to pages and navigate to another page on button click. Such navigation capabilities are important for story telling and for emphasizing elements on the screen.
This changes with the October release of Power BI Desktop which brings a set of navigation capabilities, including bookmarks, spotlight, and selection page.
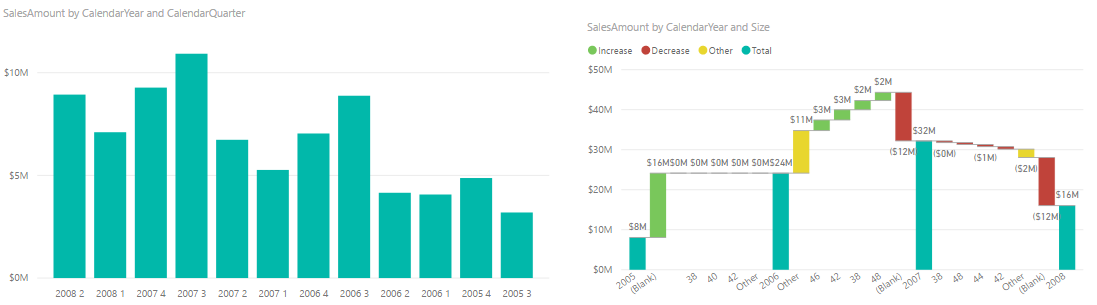
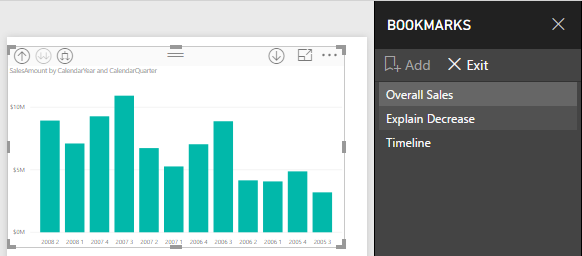
Suppose you have a meeting and walk management through the sales performance of your company. You start with a bar chart. There is a decrease in sales in which you can explain by using the Analyze Increase/Decrease which I discussed here. Now you have two visuals on the same page:
But at the beginning of your presentation, you’d want to bring focus on the bar chart, explain the overall trend, and then focus on why sales have decreased (the waterfall chart). You can use bookmarks to achieve this.
Open the new Selection pane (in the View ribbon tab) and hide the Waterfall chart.
While on the View ribbon tab, check the Bookmarks pane. Click Add to bookmark the state of the current page.
Unhide the waterfall chart and create another bookmark.
Now you have two bookmarks that show/hide visuals on the same page. This is conceptually similar to the Power Point animation pane although bookmarks don’t come up with cool entry and exit animations. Now when you present, you can simply use the Bookmarks pane for navigation the way you can use a Table of Contents (TOC) in a Word document.
Bookmarks are a welcome new Power BI feature. They are important for data story telling and for improving the navigation experience in a busy report.
 Bring your data to life today and learn how Power BI changes the way everyone gains insights from data.
 hope you’re enjoying this special time of the year – time for sharing and giving. Speaking of sharing, how does your company share BI artifacts with your B2B or B2C partners? Do you still send Excel spreadsheets or embed canned SSRS reports? If so, Power BI offers a better sharing model and I’ll show you how in this letter. And about Power BI, I’m proud to announce that the third revision of my “Applied Power BI Book” should be out in a week or so. Thoroughly updated to reflect the latest of the ever-changing cloud world of Power BI and featuring 20% new content, this book is the self-study resource your organization needs to master Power BI.