Atlanta MS BI Group Meeting on March 27th

MS BI fans, join me for the next Atlanta MS BI and Power BI Group meeting on Monday, March 27th at 6:30 PM. Dave Tangren and Nelson Davis from Slalom will compare Power BI to Tableau. Slalom will sponsor the event. I’ll show the latest of the Power BI Matrix visual. It will be a great meeting!

Presentation:Comparing Power BI to Tableau
Level: Intermediate
Date:March 27, 2017
Time6:30 – 8:30 PM ET
Place:South Terraces Building (Auditorium Room)

115 Perimeter Center Place

Atlanta, GA 30346

Overview:Power BI is getting stronger all the time. So is its competition. Want to see how Power BI stacks up against Tableau? Come see our thought leaders from Slalom debate the points!
Speaker:Dave Tangren is a Practice Area Leader for Slalom in Atlanta. Dave brings thought leadership in visual analytics and business discovery to the market. With his deep background in Microsoft technologies, we can bet we know who Dave will be representing in this presentation.

Nelson Davis is passionate about data storytelling, Tableau evangelism, data for good and providing innovative solutions to drive business impact. Nelson helps lead Slalom’s data visualization team in Atlanta, and regularly presents at the Atlanta Tableau User’s Group. Former Tableau Zen Master, multiple time winner of Viz of the Day, and speaker at TCC13, DATA15 and DATA16.

Sponsor:Slalom is a purpose-driven consulting firm that helps companies solve business problems and build for the future. We’re a team of thinkers, makers, and doers that came from enterprises, consultancies, agencies, and startups—all attracted by the promise of loving work and life. Our teams are deeply connected and bring their shared experiences and insights across industries, disciplines, and markets to each and every engagement.
Prototypes with Pizza“The Matrix Reloaded” by Teo Lachev will demo the latest enhancements to the Power BI Matrix visual.


“Get the Most Out of Power BI” Seminar on May 3rd

Patrick LeBlanc and I will deliver a free seminar “Get the Most Out of Power BI” on May 3rd, 8:30 AM to 12 PM, at the Microsoft Office in Alpharetta.

You won’t want to miss this educational and engaging event! Please register today as seating is limited at https://prologika.com/event/get-the-most-out-of-power-bi/.

Power BI is about empowering all types of users to get insights from data. It consists of the Power BI Service (powerbi.com), Power BI Desktop, Power BI Mobile, and Power BI Embedded, and it comes in two pricing options: Power BI Free and Power BI Pro. Power BI enjoys a tremendous momentum and industry observers has given it high scores. Packed with a dizzying variety of features, Power BI supports different solutions but it might be difficult to understand which features you need to reduce licensing cost.

Join Prologika and Microsoft for a 3-hour free seminar on Wednesday, May 3rd, 8:30 AM -12 PM ET, at the Microsoft Office in Alpharetta, when Teo Lachev (CEO of Prologika) and Patrick LeBlanc (Data Platform Solutions Architect at Microsoft) share practical knowledge and experience to help you get the most out of Power BI. If you’re planning Power BI rollout in your organization, this event is for you. Join Prologika and Microsoft for a 3-hour free seminar on Wednesday, May 3rd, 8:30 AM -12 PM ET, at the Microsoft Office in Alpharetta, when Teo Lachev (CEO of Prologika) and Patrick LeBlank (Data Platform Solutions Architect at Microsoft) share practical knowledge and experience to help you get the most out of Power BI. If you’re planning Power BI rollout in your organization, this event is for you.

Learn tips and tricks to stay within Power BI Free and reduce cost, including:

  • Simple sharing
  • Content service packs
  • Avoid gateways for refreshing imported data
  • Deploy Power BI reports on-premises
  • Share reports with external users

Power BI customer stories from the frontline

  • Learn how other customers use Power BI
  • Learn top customer issues when adopting Power BI that we have faced
  • Explore different problems and how we have fixed them

Ask questions and get them answered

“7 Ways to Integrate Excel with Power BI” Presentation on April 19th

I’m presenting “7 Ways to Integrate Excel with Power BI” for the Atlanta Modern Excel Group on April 19th at the Microsoft office in Alpharetta. Prologika and Microsoft are sponsoring the event. Please RSVP here.

Power BI is gaining a momentum but Excel still rules the corporate world. Fortunately, Power BI and Excel are not exclusive choices. Join me to learn how you can preserve your Excel investment in Power BI.

I’ll start by explaining the value Power BI brings to different types of users. Then, I’ll discuss and demo seven options for integrating Excel with Power BI:

  • Import Excel files in Power BI Service
  • Build self-service data models from Excel data
  • Deploy Excel models to Power BI
  • Convert Excel models to Power BI
  • Connect to Excel reports
  • Analyze Power BI datasets in Excel
  • Add Excel reports to Power BI dashboards

Editing and Creating Reports in Power BI Embedded

I was doing a Power BI Embedded demo for a customer and lo and behold, being an ever-changing cloud technology, Power BI Embedded surprised me in a great way. When you install and run the Embedded Sample, it adds a nice “Embed and play with current report using Embedded Live Sample” link to the Page Navigation section.

This brings you to the Power BI Embedded live sample with your Power BI Embedded report loaded. You can access the Live Sample from here if you don’t want to configure and install Power BI Embedded sample. In this case, it uses sample reports. Not only does the sample show you Power BI Embedded in action but it also shows you the relevant code.

The surprise is that Power BI Embedded now supports Edit and Create modes!

Similar to Power BI Services, users can now edit existing reports and create their own reports from scratch. For more details of how to do this programmatically, read the documentation.

pbiembedded

SSRS Tabular Query Designer

Analysis Services Tabular has gained a lot of momentum for implementing organizational semantic models but its toolset has been lacking. SSRS developers had to rely previously on the MDX Query Designer to send MDX queries to Tabular. If DAX queries were preferred (and they often are for better performance since DAX is the native Tabular query language), developers had to type in DAX manually. And if the query would take parameters then the ugly workaround was to use … the DMX Query Designer.

As Chris Finlan announced yesterday, this will all change starting with the newly released Report BuilderSSDT 17 (currently in release candidate state), and SSMS 17 (also in RC state), as they now feature a Tabular Query Designer. SSMS also includes DAX Query Editor, as Christian Wade explains here.

If you’re familiar with the MDX Query Designer, you already know how to use the Tabular Query Designer. When you connect to Tabular, the query designer will discover it and default to DAX query mode. The dropdown allows you to switch to MDX should you prefer to send MDX queries to Tabular.

Similar to its MDX counterpart, in most cases you’d still need to know DAX to customize your queries. If you connect to Tabular version 2016 or above, you’d be able to drag and drop metadata to autogenerate the query. I think version 2016 or above is required because the designer relies heavily on the DAX SUMMARIZECOLUMNS function, which was introduced in 2016, when autogenerating queries.

The Design Mode lets you examine the underlying DAX query and customize it as needed. Sorry, no color coding or syntax checking in SSRS, so you’d probably rely on DAX Studio to code and test your queries or the new DAX Query Editor in SSMS which has syntax checking and IntelliSense.  The Calculated Member option is disabled and you’re on your own defining custom DAX measures. No big surprises here is it works exactly in same way as in MDX (of course you need DAX formulas, such as VALUE to convert to a numeric value).

It was about time for the Tabular Query Designer to appear to help us writing DAX when designing traditional SSRS reports connected to Tabular. Watch out for a bug where auto-generated parameter datasets error out when hierarchies are used. I attach two reports. Report.rdl demonstrated an auto-generated DAX query. ReportEx.rdl demonstrates a customized DAX query.

Presenting at Birmingham SQL Saturday 2017

I’m presenting “Embed Interactive Reports in Your Apps” at Birmingham SQL Saturday 2017, on March 18th at 1 PM. I’ll discuss different options to embed Power BI reports in internal and external apps.

You have the app. You have the data. What if your app could put the power of analytics everywhere decisions are made and allow your customers to gain insights? Modern apps with data visualizations built-in have the power to inform decisions in context—for any user and on any device. Join me to discover how you can embed data analytics in any app and on one device powered by Power BI Embedded in the cloud and Reporting Services on premises.

I’ll share my experience in helping customers embed Power BI reports. Learn how to:

  • Create compelling interactive reports
  • Embed easily for faster time to value
  • Deploy quickly and manage with ease

Prologika Newsletter Spring 2017

15 Reasons Why Microsoft is Leading the BI Space


I hope you’re enjoying the beginning of 2017 and you’re staying healthy and busy. It’s been a hectic and exciting period for me. I published the second edition of my “Applied Microsoft Power BI” book in January to keep it up to date.  It’s great to see all the momentum and interest surrounding Power BI. Just last month, I taught my “Applied Power BI” class three few weeks in a row! On the implementation side of things, companies of all sizes are adopting Power BI. And, one of our customers made the Power BI blog with their CRM platform that uses Power BI Embedded to deliver interactive reports to their users!


The Gartner 2017 Magic Quadrant for BI and Data Analytics

Speaking of Power BA and its momentum, industry observers are taking notice. As Kamal Hathi (General Manager, Microsoft BI) announced, the newly released Garner Magic Quadrant for Business Intelligence and Data Analytics gave Microsoft a very high score. Read the full report here.

Of course, there are many competing definitions of what constitutes a BI and Analytics platform. Note that Gartner reviewed only Power BI and certain aspects of Cortana Analytics. Reporting Services, Analysis Services and the other on-premises and cloud Microsoft BI-related solutions are not covered, such as Azure SQL Database, SQL Data Warehouse, Azure ML, Query Catalog, Cognitive Services, HDInsight,  Data Lake, StreamInsight). If we take them in consideration, where will the dot be?

The image below shows the Microsoft’s lift between last year and this year in the Gartner magic quadrant. What a leap!

 031117_2001_PrologikaNe2.png 031117_2001_PrologikaNe3.png

I’m surprised to find that the dot is not higher on the ability to execute, especially considering that Gartner ranked Microsoft and its main rival (Tableau) almost the same. You might also find my two-part blog about Tableau vs. Microsoft useful if you are tasked to compare these two vendors.

Understanding the 15 Critical Capabilities

As explained in the report, to evaluate vendors, Gartner uses 15 critical capabilities to support five main use cases: Agile Centralize BI Provisioning, Decentralized Analytics. Governed Data Discovery, Embedded BI, and Extranet Deployments. The following table includes my comments on each of the 15 capability.

CapabilityMy Rank Teo’s Comments
InfrastructureBI Platform Administration, Security and Architecture
Capabilities that enable platform security, administering users, auditing platform access and utilization, optimizing performance and ensuring high availability and disaster recovery.

Medium to High

There are a lot of things here:
Security – More work is required to support external users in Power BI, Power BI Embedded, and SSRS
Administering users – Power BI supports a progressive deployment depending on the desired level of integration with Office 365 (unmanaged tenant, managing tenant, and federated AD)
Auditing: Power BI supports auditing access and utilization but more work is required for proactive monitoring and improving its data governance capabilities
Performance and HA: Highly-redundant and scalable backend, consisting of SSAS Tabular farm and Azure services.
Cloud BI
Platform-as-a-service and analytic-application-as-a-service capabilities for building, deploying and managing analytics and analytic applications in the cloud, based on data both in the cloud and on-premises

High

Power BI supports both pure cloud and hybrid architectures depending on data volumes and security requirements. No other vendor offers both architectures.
Data Source Connectivity and Ingestion
Capabilities that allow users to connect to the structured and unstructured data contained within various types of storage platforms, both on-premises and in the cloud.

High

As of this time, Power BI supports close to 70 connectors to let you connect to cloud and on-premises data sources. No scripting required.
Data ManagementMetadata Management
Tools for enabling users to leverage a common SOR semantic model and metadata. These should provide a robust and centralized way for administrators to search, capture, store, reuse and publish metadata objects such as dimensions, hierarchies, measures, performance metrics/key performance indicators (KPIs), and report layout objects, parameters and so on. Administrators should have the ability to promote a business-user-defined data mashup and metadata to the SOR metadata.

Medium to High

Microsoft offers an organizational BI Semantic Model (BISM) which is typically implemented as an Analysis Services Tabular or Multidimensional models. On the self-service side of things, users can create Excel or Power BI Desktop models. IT can promote a self-service Excel model to a Tabular model. Although not officially supported because Power BI Desktop is changing every month, IT can upgrade a Power BI Desktop model to a Tabular model.
Self-Contained Extraction, Transformation and Loading (ETL) and Data Storage
Platform capabilities for accessing, integrating, transforming and loading data into a self-contained storage layer, with the ability to index data and manage data loads and refresh scheduling.

Medium

SSIS is the most popular on-premises ETL tool. More work is required to bring similar capabilities in the cloud (I think Azure Data Factory is a step backwards)
Self-Service Data Preparation
The drag-and-drop, user-driven data combination of different sources, and the creation of analytic models such as user-defined measures, sets, groups and hierarchies. Advanced capabilities include semantic autodiscovery, intelligent joins, intelligent profiling, hierarchy generation, data lineage and data blending on varied data sources, including multistructured data

High

Power BI Desktop and Excel has a fantastic query editor (originated from Power Query) that scores big with business users. Other vendors that score high in the Magic Quadrant don’t have such native capabilities. Power BI and Excel have best of class self-modeling capabilities (much better than Tableau). Azure Query Catalog can be used for dataset autodiscovery.
Analysis and Content CreationEmbedded Advanced Analytics
Enables users to easily access advanced analytics capabilities that are self-contained within the platform itself or available through the import and integration of externally developed models.

High

Not sure what is meant here by “advanced analytics capabilities”. Power BI supports Quick Insights (brute-force machine learning), integration with R, Azure Machine Learning, clustering, forecasting, binning, but I might be missing something.
Analytic Dashboards
The ability to create highly interactive dashboards and content, with visual exploration and embedded advanced and geospatial analytics, to be consumed by others.

High

“Highly interactive dashboards and content” is what Power BI is all about.
Interactive Visual Exploration
Enables the exploration of data via an array of visualization options that go beyond those of basic pie, bar and line charts to include heat and tree maps, geographic maps, scatter plots and other special-purpose visuals. These tools enable users to analyze and manipulate the data by interacting directly with a visual representation of it to display as percentages, bins and groups.

Medium

Power BI covers all stated requirements in this category. However, while its visualization capabilities are improving every week, more work is required to catch up with the Tableau and Qlik in some areas, such as cell drillthrough, ability to repeat visualizations, such as to nest a bar into a table, conditional binding, exression-based properties and filters, and others.
Smart Data Discovery
Automatically finds, visualizes and narrates important findings such as correlations, exceptions, clusters, links and predictions in data that are relevant to users without requiring them to build models or write algorithms. Users explore data via visualizations, natural-language-generated narration, search and NLQ technologies.

Medium to High

Through Quick Insights, Power BI can automatically find correlations, outliers, and other hidden trends. It doesn’t currently have native narrative capabilities, except for the custom visual from Narrative Science. Power BI is one of the few vendors that offers natural queries.
Mobile Exploration and Authoring
Enables organizations to develop and deliver content to mobile devices in a publishing and/or interactive mode, and takes advantage of mobile devices’ native capabilities, such as touchscreen, camera, location awareness and natural-language query

High

Native apps for iOS, Android and Windows to surface both Power BI and SSRS reports.
Sharing of FindingsEmbedding Analytic Content
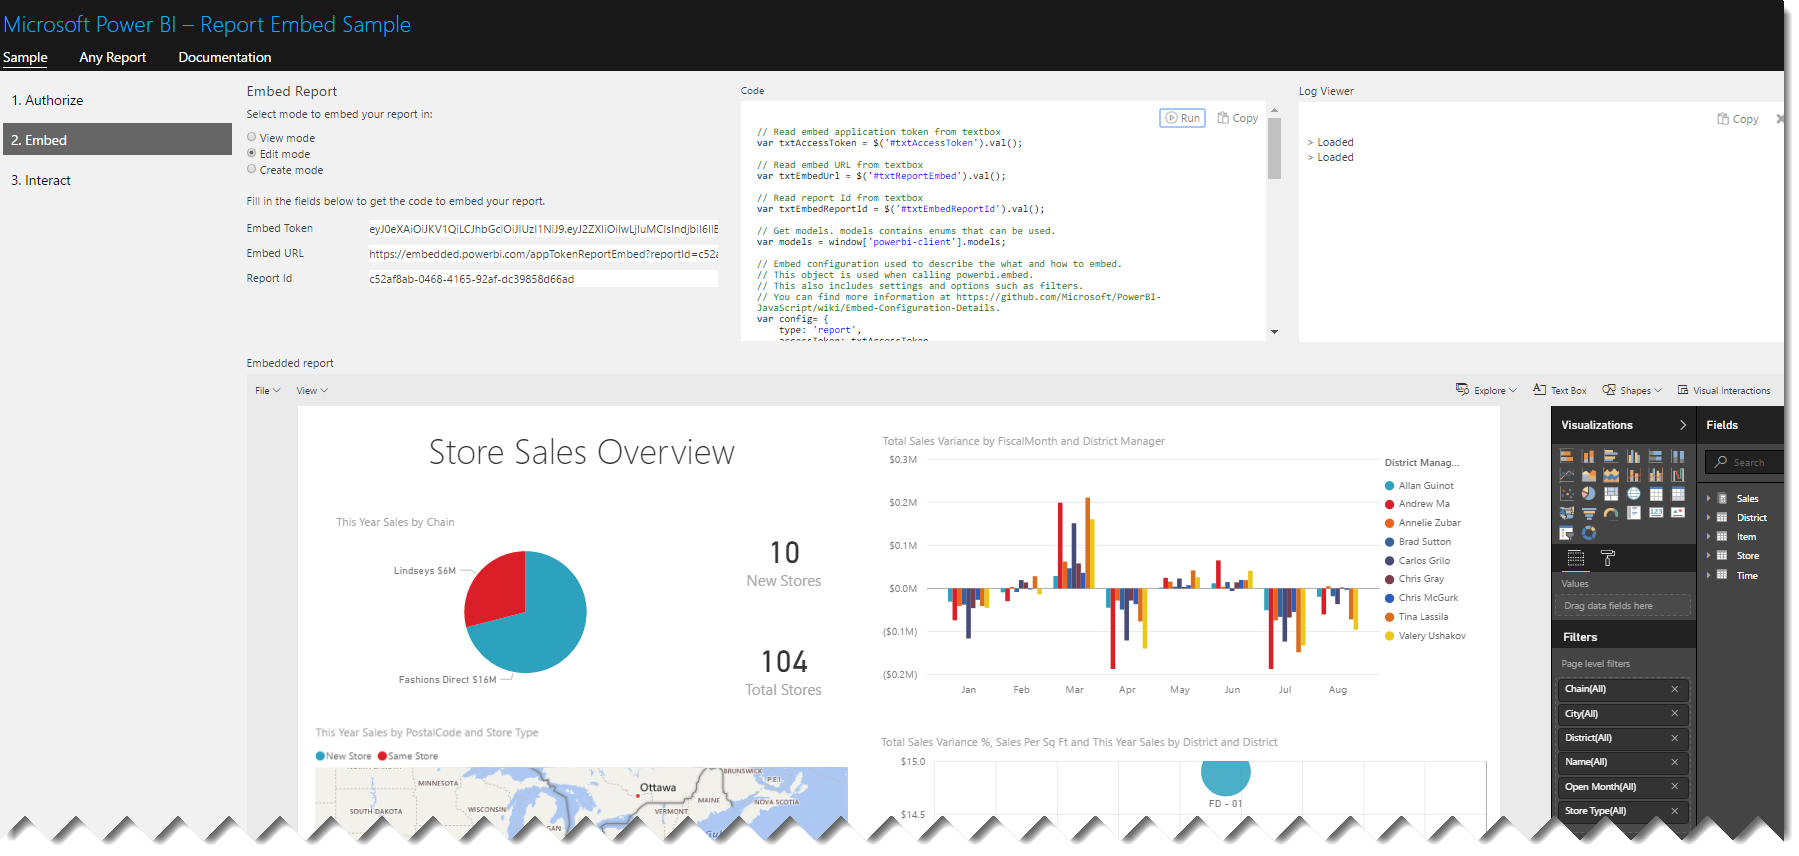
Capabilities including a software developer’s kit with APIs and support for open standards for creating and modifying analytic content, visualizations and applications, embedding them into a business process, and/or an application or portal. These capabilities can reside outside the application (reusing the analytic infrastructure), but must be easily and seamlessly accessible from inside the application without forcing users to switch between systems. The capabilities for integrating BI and analytics with the application architecture will enable users to choose where in the business process the analytics should be embedded.

High

An Azure cloud service, Power BI Embedded allows you to embed reports for external users with very appealing cost-effective licensing model. On premises, SSRS offers similar capabilities.
Publish, Share and Collaborate on Analytic Content
Capabilities that allow users to publish, deploy and operationalize analytic content through various output types and distribution methods, with support for content search, scheduling and alerts. Enables users to share, discuss and track information, analysis, analytic content and decisions via discussion threads, chat and annotations.

High

Power BI supports subscriptions and data alerts but we can do better, such as to allow an admin to subscribe other users. Power BI workspaces and groups allow users to share BI artifacts, participate in discussion lists, and share calendars. Power BI Mobile allows users to annotate reports.
Overall platform capabilities Platform Capabilities and Workflow
This capability considers the degree to which capabilities are offered in a single, seamless product or across multiple products with little integration.

Medium to High

The integration hub is Power BI Service which integrates Power BI reports, Excel reports, SSRS reports. More work is required on integration with Excel reports that connect to SSAS models.
Ease of Use and Visual Appeal
Ease of use to administer and deploy the platform, create content, consume and interact with content, as well as the visual appeal.

High

As far as deployment, Power BI is “five seconds to sign up, five minutes to wow!” As far as the visual appeal, beauty is the eye of the beholder but Power BI has done respectable job to follow best visualization practices.

MS BI Events in Atlanta

  • Atlanta MS BI and Power BI Group: “Comparing Power BI to Tableau” presentation by Slalom Consulting on 3/27
  • Atlanta MS BI and Power BI Group: “Using Power BI with Visual Studio Team Services” on 4/24.
As you’d probably agree, the BI landscape is fast-moving and it might be overwhelming. If you need any help with planning and implementing your next-generation BI solution, don’t hesitate to contact me. As a Microsoft Gold Partner and premier BI firm, you can trust us to help you plan and implement your data analytics projects, and rest assured that you’ll get the best service.

Regards,

sig-1

Teo Lachev
Prologika, LLC | Making Sense of Data
Microsoft Partner | Gold Data Analytics

Implementing Header-Details in Power BI

Lots of things to like in the just released March update of Power BI Desktop! My favorite? We can now implement header-details text reports using the updated Matrix visual. Previously, Table and Matrix visuals wouldn’t allow you to select a row to cross filter other sections. Now, you can use the Matrix visual for the header section. When you click a row in the “header”, other visuals get cross-filtered. In the screenshot below, the Table visual shows all customers who have purchased the selected product. Also, notice that the Slicer visual has also been upgraded to allow sliding a numeric measure.

030717_0323_Implementin1.png