Join Satya Nadella (CEO Microsoft), James Phillips (Corporate Vice President, Business Applications, Platform and Intelligence), Judson Althoff (Executive Vice President, Worldwide Commercial Business) for major announcements and details on the “new generation” of Power BI, Dynamics 365 applications, LinkedIn, and the Microsoft Cloud.
This should be an important event not to miss!
https://prologika.com/wp-content/uploads/2016/01/logo.png00Prologika - Teo Lachevhttps://prologika.com/wp-content/uploads/2016/01/logo.pngPrologika - Teo Lachev2017-04-29 10:29:172017-04-29 10:31:47Important Power BI Announcements on May 3rd
MS BI fans, join me for the next must-attend Atlanta MS BI and Power BI Group meeting on April 24th at 6:30 PM. Mike Bruce and Alex Higgins from Acuity Brands will share how they use Power BI to improve their development process. Acuity Brands will sponsor the event. And I’ll demo the new Quick Measures Power BI measure.
Presentation:
Using Power BI to Track Software Development Performance
Level: Intermediate
Date:
April 24, 2017
Time
6:30 – 8:30 PM ET
Place:
South Terraces Building (Auditorium Room)
115 Perimeter Center Place
Atlanta, GA 30346
Overview:
By using Power BI, Acuity Brands can monitor development teams’ progress with rich, interactive dashboards. Data from Visual Studio Team Services ODATA feeds and APIs as well as pulling data from DocumentDB, teams can drill into their development performance and see where they may be having development performance. Data is accessed via embedded Power BI reports running on dedicated hardware throughout development team spaces as well as accessible via the web using SSO!
Speaker:
Mike Bruce has been developing software for the past 22 years focusing on Microsoft products. He is currently runs the DevOps and QA team for Platform Architecture at Acuity Brands.
Alex Higgins recently joined Acuity Brands via the Leadership Program. He has lead the effort to build custom visuals in PowerBI as well as creating embedded reports.
Sponsor:
Acuity Brands is the North American market leader and one of the world’s leading providers of lighting solutions for both indoor and outdoor applications. We provide customer-driven smart and simple lighting solutions that offer quality lighting and value-added benefits by empowering world-class talent to create and leverage our industry-leading portfolio of products, technology, and services; drive world-class cost efficiency; and leverage a culture of continuous improvement.
https://prologika.com/wp-content/uploads/2016/01/logo.png00Prologika - Teo Lachevhttps://prologika.com/wp-content/uploads/2016/01/logo.pngPrologika - Teo Lachev2017-04-22 22:02:122017-04-22 22:02:12Atlanta MS BI Group Meeting on April 24th
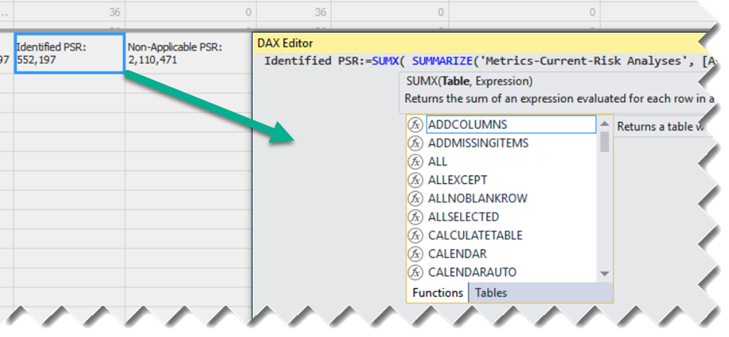
The Tabular toolset is getting better. One thing that I miss from Multidimensional is the cube script that lets you view all custom calculations in one place so that you can organize them any way you want, add comments, etc. This is why I contributed to the DAX Editor tool. Microsoft has taken notice and introduced a tool (also called DAX Editor) in the latest SSDT release. Read Kay Unkroth’s announcement here.
The Microsoft DAX Editor supports the old XML-based schema and the new JSON schema. On the upside, it gives you a break from the Measure Grid and the formula bar. On the downside, you can work only on one measure at the time. So, let’s leave it to marinate it a few more months with the hope that we can finally have a Tabular script. As Kay commented at the end of his blog post there is a hope:
Yes, we are hearing this a lot from you guys! Having all expressions in a single document makes it easy to find and replace, search, etc. It’s on the backlog, but not yet on the top of the priorities. Looking at the higher prio work we still need to get done , it’s more mid-termish. But we know how we want to achieve this and we are laying down the foundation with this DAX Editor. Btw. it is much, much more than just an editor window. That is really just the tip of the iceberg. Same with the DAX query window in SSSM. The real beauty (and complexity) is in the DAX parser behind these windows, and a few other features like IntelliSense. It’s coming together. Brick by brick!
Excel 2016 added a Publish to Power BI menu to let you export or connect Excel workbooks to Power BI. You can read more about this Excel feature here. One area where Excel is still ahead of Power BI Desktop is that is has an object model that lets you automate tasks with VBA. Unfortunately, Power BI Desktop doesn’t have an object model so you have to resort to unsupported ways (aka hacks) to automate tasks, such as refreshing and publishing to Power BI. I discussed some here.
I’ve noticed that Microsoft added not yet documented PublishToPBI method to Excel 2016. With it, refreshing the Excel data model and publishing it to Power BI Service takes two lines of code (you’d need more code to open the Excel workbook from an external application).
https://prologika.com/wp-content/uploads/2016/01/logo.png00Prologika - Teo Lachevhttps://prologika.com/wp-content/uploads/2016/01/logo.pngPrologika - Teo Lachev2017-04-18 16:26:342017-04-18 16:26:34Automating Excel to Power BI Publishing
One of the most common complaints raised by Power BI customers is the DAX steep learning curve. The April release of Power BI Desktop introduces a feature called Quick Measures. Currently in preview (make sure to enable Quick Measures from File ð Options and settings ð Options, Preview features), Quick Measures are supposed to replace Quick Calcs. Besides supporting only a limited number of packaged calculations and not working on top of custom measures, the problem with Quick Calcs is that they don’t show the DAX formulas so there isn’t a way for you to learn from the work Microsoft did or to change the formulas to customize their behavior. This changes with Quick Measures.
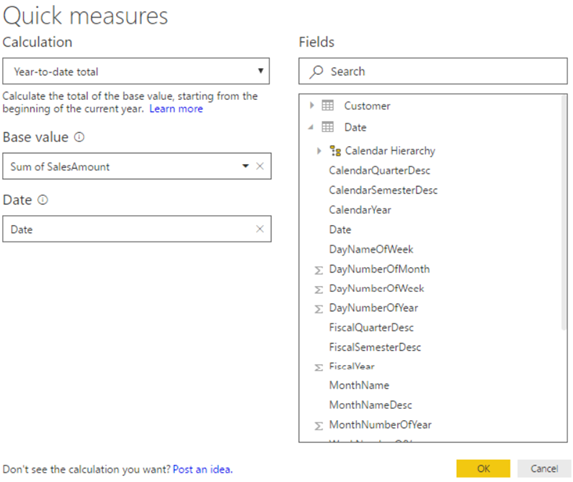
You can create a Quick Measure over implicit or explicit measures. To do so, once you add a field to the report, expand the measure drop-down in the Fields of the Visualizations pane, and the click “Quick measures”. Then, select the calculation type. Currently, Power BI Desktop supports about 20 quick measures organized in four categories: Aggregate by category (average, min, max, variance), Filters (filtered value, difference or percentage from filtered value), Time intelligence (YTD, QTD, MTD, and their variances), Running total, Mathematical operations (additions, subtractions, division, multiplication, percentage difference).
For some obscure reason, the YTD quick measure I tried works only with an inline date hierarchy (Power BI Desktop can auto-generate an inline date hierarchy when you add a Date field to the report). But fear not! Once you create the quick measure, it becomes a regular measure and it gets added to the Fields list. Which means that you can change its formula! This is the auto-generated one.
SalesAmount YTD =
IF(
ISFILTERED(‘Date'[Date]),
ERROR(“Time intelligence quick measures can only be grouped or filtered by the Power BI-provided date hierarchy”),