I often ask prospects if they’ve done any estimates of the value that the envisioned BI solution would bring to them. The Microsoft Solution Framework actually recommends partners do this during the planning phase. Alas, the answer is almost always negative. Then I ask what criteria would be used to evaluate if my price (I give fixed value-based prices as I don’t sell time) would yield a good ROI and then there is an awkward pause. Instead, the buyer typically uses a top-down approach for selecting a consultant. The buyer either has some budget constraints and solicits multiple quotes to find the “best” fit. There is nothing wrong with this, of course, given that ROI for BI is notoriously difficult to determine.
Consultancies and advisory firms have some sort of a “seat-of-the-pants” methodology to help the customer come up with ROI if this is deemed important. But you might not have to go through this exercise as research companies has done the math for you. For example, Nucleus Research has estimated that BI delivers 1300% ROI!
“In analyzing Nucleus ROI case studies on analytics, we found the average returns from analytics have been increasing, reaching $13.01 for every dollar spent in 2014 from just $10.66 in 2011.”
Often, the benefits of an effective and insightful BI solution can only be realized after the customer has started using the solution. I’m always delighted when customers report that our solution has paid for itself in the first year or so. For example, an insurance company that has found that customers underreport their risk exposure and justifiably increased premiums. Or, another client that has found that data analytics transformed the organization’s data into a key strategic business asset, empowering employees like never before.
What’s your ROI for BI?
https://prologika.com/wp-content/uploads/2016/01/logo.png00Prologika - Teo Lachevhttps://prologika.com/wp-content/uploads/2016/01/logo.pngPrologika - Teo Lachev2017-06-29 20:42:522017-06-29 20:43:19What’s ROI for BI?
Scenario: Consider a SQL Server configured for AlwaysOn Availability Groups where a set of databases can fail over to another node. You have SSIS jobs and you created them on both nodes. However, you need to check if the current node on which the job is running is the primary node. If you don’t do this, the job fails because the database isn’t accessible.
Solution: In every SQL Server Agent Job, add a first step to check if one of the replicated databases in the AlwaysOn availability group is the primary replica:
IF sys.fn_hadr_is_primary_replica (‘<replicated dataset name here>’) = 0
BEGIN
EXEC msdb..sp_stop_job N’DW Daily Load’;
END
This script checks if the database is a primary replica. If this is not the case, the script stops the next step, which in this case is the “DW Daily Load” step.
After Tableau and SiSense, Keeping ’em Honest continues with Qlik. Now, after they sold the company and took a hit in the latest Gartner’s quadrant, I didn’t expect much of a completion from Qlik but every now and then I run into a customer considering Qlik and willing to share Qlik’s feedback on how Qlik outshines Power BI in every possible way (can’t share these documents due to NDA although they are interesting and entertaining stories). But to be fair to Power BI, I’ll enumerate next a few reasons that customers have shared of why they prefer Power BI over Qlik and from my experience in in helping several customers transition to Power BI from Qlik. I’ll focus on Qlik Sense, which is the Qlik’s latest tool that competes head to head with Power BI.
Chasing the perfect tool (hint: there is none)? Instead, focus on architecture and data quality. Tools come and go, and they tend to leapfrog each other. Data quality and good foundation stays on.
Data Acquisition
Connectors – the data journey starts with connecting to your data. According to Qlik’s documentation, it offers a very small set of connectors. By contrast, Power BI supports over 70 connectors and the list growing every month.
Content packs – In Power BI, content packs delivered by Microsoft partners allow business users to get pre-packaged reports and dashboards from popular cloud services, such as Dynamics CRM, Salesforce, Google Analytics, Marketo, and many more, directly in Power BI Service (no need to use Power BI Desktop). No such a feature exists in Qlik.
Complexity – One prevailing theme I hear from Qlik users is complexity where the tool requires the end user to be a developer to create scripts and import data. In fact, I know of a large organization in Atlanta which has hired a consulting company to create and maintain Qlik reports. So much about the self-service BI story. By contrast, Power BI Service and Power BI Desktop include user-friendly wizards.
Data transformation – In Power BI Desktop, a data analyst can use the Query Editor to define repeatable steps to transform and cleanse the data before it’s imported in the data model. The Query Editor (Power Query in Excel) resonates well with business users. No such a tool exists in the Qlik world
Data Model
Associative data model – Qlik continues to tout the “associative data model” (learn more in this video and its related videos on YouTube). Besides the self-service vs organizational BI propaganda, nothing new here that Power BI can’t do. As far as the extolled virtues of the “associative data model”, I couldn’t agree more with what Donald Farmer (a former Vice President at Qlik) had to say a while back. “Talking of engines, some have been misled to believe that QlikView’s supposed “associative analysis” represents some significant engine smarts. I have even heard analysts very misleadingly say that QlikView has “association rules” – implying some kind of data mining, such as Microsoft implements in its Data Mining server and Excel Add-ins. QlikView add to the confusion by talking about an associative “architectural model.” However, despite the hype, as Curt Monash points out (or rather, painfully extracted from QlikTech themselves through a long thread of comments) it is not so: “The associative aspect is really more meaningful in describing the end user experience, in that you see visually what is associated and is not associated with any particular selection or drilldown.” As Curt says, “Thank you for admitting that clearly!!! It wastes a fair amount of analysts’ time when your company pretends otherwise.” So, the associative model is nothing more that the relationship auto-discovery in Power BI Desktop.
Data model capabilities — I said this many times and I’ll say it again – no other tool on the market comes even close to Power BI as far as its modeling capabilities which allow business users to create self-service data models that are on a par with models created by BI pros.
Calculations – In Power BI, we use DAX, a language that is far more powerful than Qlik expressions.
Platform
Ecosystem — No matter how good it is, a self-service visualization tool addresses only a small subset of data analytics needs. By contrast, Power BI is a part of the Microsoft Data Platform that allows you to implement versatile solutions and use Power BI as a presentation layer. Want to implement a real-time dashboard from data streams? Azure Stream Analytics and IoT integrates Power BI. What to show reports on the desktop from natural questions? Cortana lets you do it by typing questions or voice. Want to implement smart reports with predicted results? Power BI can integrate with Azure Machine Learning? Want to publish SSRS and Excel reports alongside interactive reports? Power BI supports this. Expect this strength to increase as Cortana Analytics Suite and prepackaged solutions evolve.
Scalability and continuum – Despite Qlik’s scalability white papers that claim to scale to billions of rows, a desktop tool can get you up to a few million rows. Even if its technology can scale to much bigger data volumes, working with gigabyte files is no fun. Not to mention that you’d probably wouldn’t want millions for rows imported and exported all the time. At some point, you have to consider moving your models to a dedicated server. In MS BI, you can transition from Power BI Desktop to Tabular on the server. Same technology, same interfaces. In fact, I tell students that if you know Power BI Desktop, you already know 80% of Tabular. What’s Qlik’s continuum story?
On your terms – Power BI lets you deploy your report to the cloud Power BI Service and on premises to the Power BI Report Server. Qlik is predominantly on-premises solution with a fledgling cloud offering. Besides, Qlik Sense Cloud is more expensive at $25/month vs $10/mo in Power BI (if you decide to go cloud).
Analytics
Natural language – No equivalent to Power BI Q&A which allows business users to ask natural questions. Qlik has a basic story telling via the Narrative Data Science and so does Power BI.
Advanced analytics – No integration with R or built-in machine learning capabilities, such as Quick Insights in Power BI.
Real-time dashboards – Qlik doesn’t have the API to allow developers to push data to a dashboard that updates in real time.
Geospatial reporting – Qlik’s geospatial reporting is not as robust as Power BI. For example, Power BI offers at least four mapping visualizations, including ShapeMap (supports custom shapes) and ArcGIS
Openness
Reporting tools – Reporting tools come and go. If make a decision to go with Qlik, can you use another reporting tool to connect to it? By contrast, in Power BI you can analyze your data with any DAX or MDX capable tool, such as Excel.
Custom visuals – Qlik claims that it can integrate with D3.js to allow developers to create custom visuals. In reality, Qlik extensions basically spit out HTML. By contrast, Power BI custom visuals adhere to predefine interfaces. What this means for a developer is that it’s much easier to implement and test custom visuals in Power BI.
Other
Cost – I’ll let you do your own math here but the number one reason customers gravitate to Power BI is cost.
Speed – Power BI gets new features every month. How often is Qlik updated?
https://prologika.com/wp-content/uploads/2016/01/logo.png00Prologika - Teo Lachevhttps://prologika.com/wp-content/uploads/2016/01/logo.pngPrologika - Teo Lachev2017-06-22 09:46:162021-02-17 01:01:43Power BI vs. Qlik
As I mentioned in my Spring newsletter “15 Reasons Why Microsoft is Leading the BI Space”, Microsoft BI is enjoying resurgent interest from customers and industry observers, and Power BI gets lots of attention. I’m sure that you’ve also heard the announcements about Power BI Premium – a new dedicated licensing model for Power BI. In fact, Power BI Premium is so important to Microsoft that it’s positioned as a new product under the Power BI umbrella name instead of a new licensing model. In this newsletter, I’ll discuss what Power BI means for you and why you should strongly consider it. If you live in these cities, consider joining me at SQL Saturday Chattanooga on June 24th or the Atlanta MS BI Group on June 26th when I’ll present “Understanding Power BI Premium” and discuss its inner workings in more detail. My June calendar has the details about these events.
Why Power BI Premium?
According to Microsoft, for less than 2 years since Power BI became generally available, more than 5 million users are currently using it. As the product matures, the following growing pain points have emerged:
Per-user licensing model – Large organizations find it difficult to license Power BI per user. A case in point – one year after a successful Power BI hybrid pilot, a Fortune 100 organization has purchased whopping 5 Power BI Pro licenses. There are several reasons for the slow adoption by large companies but one of them is the per-user license.
Cost prohibitive with large user base – The per-user licensing model doesn’t include a “reader” license. If a report has a Power BI Pro features, all users accessing reports would need Power BI Pro licenses. So, if you a report that used Power BI Pro features, such as gateways or live connections, and you won’t this report to be available to 1,000 users, you had to foot $10,000/month bill because everyone required Power BI Pro.
Performance – Power BI Service is a shared cloud environment. Although no one has shared performance issues with me, it’s possible that the performance of your reports might be negatively affected by other organizations.
No “premium” features – When I teach Power BI I often get feedback that some missing features, such as caching and incremental refresh, are important. This goes back to performance but the reason why they are not currently available is because they might impact performance in a shared environment.
Confusing licensing – Previously, there was some overlap between Power BI Free and Power BI Pro. Many organizations find it very difficult to navigate what features are available where.
What’s There to Like in Power BI Premium?
There are several reasons why Power BI might be appealing to your organization.
To start with, larger organizations can save on licensing cost. If all users would need access to reports with Pro features, the breakpoint at which Power BI Premium reduces cost is above 500 users. That’s because, Power BI Premium allows Power BI Free users to access Pro content without Power BI Pro licenses. You can use the Power BI Premium calculator to experiment with what-if scenarios and calculate your licensing cost.
Cost savings is not the only reason to consider Power BI Premium. You also get dedicated capacity. When you purchase Power BI Premium, you buy a dedicated environment for your organization. Think of it as buying a dedicated IaaS service, such as an Azure VM, versus a PaaS service, such as an Azure SQL Database, that is shared with other users on the same server. For more information about how this works and what Premium plans are available, read the Power BI Premium whitepaper.
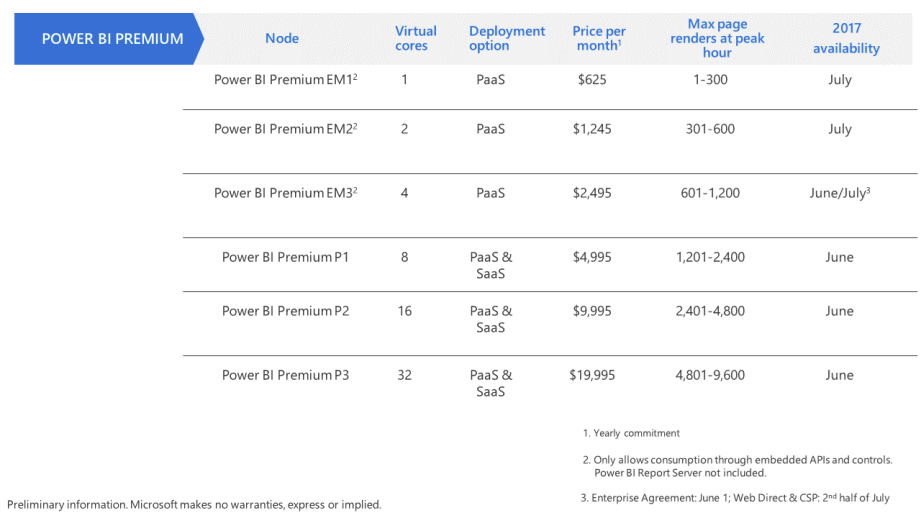
Almost organization I’ve consulted with has the need to embed reports for a third party. Previously, if you want to embed Power BI reports, you had to use the Azure Power BI Embedded Service, which was separate from the Power BI Service. Consequently, Power BI Embedded had to catch up with Power BI Service. For example, it still doesn’t have connectivity to on-premises data sources. The good news is that Power BI Embedded marries Power BI Service (Power BI Premium = Power BI Service + Power BI Embedded) so there will be feature parity. If you are concerned about the increased licensing cost (Power BI Embedded has an hourly-based session licensing model), Microsoft unveiled low-cost Power BI Premium plans targeted to report embedding only and starting at $625/month.
Another appealing detail concerning embedded analytics is that unlike Power BI Premium which requires reports authors to have Power BI Pro licenses, creating new embedded reports or changing existing embedded reports by external users don’t require a Power BI Pro license. Of course, if your organization purchases a Power BI Premium plan, such as P1 starting at $5,000/month, not only will you be able to use Power BI Premium for internal use, but you can also embed reports for external customers. In other words, one Power BI Premium license covers both internal and external reporting.
Finally, Power BI Premium-only features are in the works, such as real-time caching by pinning datasets to memory, incremental dataset refresh, secondary model copies for disaster recovery, and geo replicas to reduce latency by replicating instances around the world.
Changes to the Power BI Portfolio
You might wonder how Power BI Premium impacts your current Power BI usage. The table below shows how Power BI Premium changes the Power BI portfolio.
Today
Future
Power BI Desktop
Connect to 70+ data sources
Data transformations
Report creation and exploration
No changes
Power BI Free
No live connections, No gateway connectivity
Smaller capacity limits and data refresh rates
Only simple dashboard sharing
Power BI Pro feature parity No sharing (not even simple dashboard sharing)
Power BI Pro
Access to all data sources
Larger capacity limits and data refresh rates
All sharing options (simple, workspaces, org content packs)
No changes
Power BI Premium
Increased capacity limits Dedicated environment Content distribution (reader license) Power BI Report Server More features in future (read the whitepaper)
So, don’t panic! You can continue using Power BI under the current per-user licensing model (Power BI Free and Power BI Pro) if Power BI Premium makes no sense to you. Another good news is that Power BI Free now has all the Power BI Pro features, so hopefully we won’t see “This report requires Power BI Pro license” anymore. The bad news is that with per-user licensing, Power BI Free is for individual use only. A Power BI Free user can’t share any Power BI content (not even simple dashboard sharing). And, unless you purchase Power BI Premium, content can’t be shared with Power BI Free users (Both inbound and outbound sharing are not available for Power BI Free users).
Power BI Report Server
Delivering on its on-premises reporting roadmap, Microsoft has extended SQL Server Reporting Services (SSRS) to support Power BI reports. The extended SSRS will be known as Power BI Report Server. Moreover, Microsoft has decoupled SSRS from SQL Server so it gets more frequent updates. Moving forward, SSRS becomes two products:
SSRS – This is the SSRS we know it but with no Power BI integration. It will get new RDL features but no Power BI integration features.
Power BI Report Server – It gets both RDL and Power BI features. As far as the reason for the name change, the Power BI name is a strong brand while SSRS has been associated with the old style paginated reports.
You can get Power BI Report Server in two ways:
As a part of the Power BI Premium plan where you get the same number of licensed on-premises cores as the v-cores you purchased within your Power BI Premium plan. You can use these licensed cores only for Power BI Premium Report Server (SQL Server requires a separate license if you install it on the same box as Power BI Premium Report Server).
Standalone and covered by a SQL Server Enterprise Edition with Software Assurance license. Currently, SQL Server doesn’t check for Software Assurance in any way (there isn’t such SKU). So, Power BI Premium licensing would be an honor system for customers who want to get it standalone (with SQL Server Enterprise Edition licenses).
So, although Power BI Premium Report Server has divorced SQL Server, you can still cover by the SQL Server license (kind of when you send your kid to college but she still lives with you). In both cases, developers publishing Power BI reports to the Power BI Report Server will require a Power BI Pro license at $9.99/user/mo.
As you’d probably agree, the BI landscape is fast-moving and it might be overwhelming. If you need any help with planning and implementing your next-generation BI solution, don’t hesitate to contact me. As a Microsoft Gold Partner and premier BI firm, you can trust us to help you plan and implement your data analytics projects, and rest assured that you’ll get the best service. Regards,
Teo Lachev
Teo Lachev President and Owner Prologika, LLC | Making Sense of Data Microsoft Partner | Gold Data Analytics
SQL Server 2017 introduces the ability to scale out SSIS. The primary scenario is to enable customers to scale out their SSIS execution at the package level. Imagine a retail business that has about 300 packages to run at the end of the day to push transactional data/finance data from multiple stores to the centralized data warehouse for reporting. All the 300 packages need to run at night but they also need to finish by 6 AM in the morning before new business day starts. As business grows, data size grows, and it takes longer time to run the 300 packages and it is becoming more difficult for the ETL processing window to finish before 6 AM. With SSIS scale out feature, you can now set up the scale out cluster with 1 master and N workers, so that the master can automatically distribute the packages to the workers based on the worker availability, therefore, it helps parallelize the execution at package level and achieve faster completion time. You don’t have to worry about which packages will be executed by which worker, as it’s handled by the master. All you need is to deploy the 300 packages into the catalog and then trigger the ETL run.
Sounds like an easy fix to your long ETL processing times? As with any technology, my advice is to focus on improving the performance of your ETL first, then scale up, then scale out. Here are the top 5 performance issues that I see over and over in my consulting practice:
No parallelism – Packages run sequentially, e.g. dimensions are populated one by one and then fact tables one by one. Meanwhile, despite all the CPU power and cores you fought hard to secure, the server isn’t doing much. Instead, you should run things in parallel as much you can with the goal to saturate that server CPU bandwidth. Ideally, you should invest into a framework that can automatically distribute work across packages with on a configurable degree of parallelism, as the one that we use and is mentioned in my newsletter ” Is ETL (E)ating (T)hou (L)ive?”.
No incremental extraction – The less data you process, the faster your ETL will be. You should strive to extract only the rows that have changed if possible, using techniques such as LastUpdated timestamp, Temporal tables, or CDC.
ETL instead of ELT pattern – Influenced by Microsoft and expert advice, you’ve decided to use the data flow transforms. For example, in a recent ETL review, I found that a Lookup task caches all the 50 million rows from a fact table in memory to determine a row should be inserted or updated! What happens when (not if) one day the fact table swells to 500 million rows? Instead, almost always the ELT pattern that relies on stored procedures and T-SQL MERGE would be a better choice from a performance standpoint. 30 years went into improving and evolving Microsoft SQL Server. It would be naïve not to take advantage of this evaluation and its set-based processing. And as a bonus, one day if you decide to migrate your DW to the cloud, such as by using Azure SQL Data Warehouse, you’ll find that ELT is recommended (unfortunately, Azure SQL DW still doesn’t support MERGE but one day I hope it will).
Query optimization – Needless to say, your queries should be optimized. In the same recent review, I found that one query that extract data from ODS takes four hours to execute!
Excessive data movement – This goes back to incremental extraction but I often see ETL that does full load or partial load (e.g. the last six months) and copies millions of rows from source to staging table 1, staging table 2, …, and finally data warehouse.
If, after you follow the above best practices, you still find that you’re exceeding your ETL processing windows, you should consider scaling out SSIS. Before doing so, consider the following limitations in the SSIS scale-out feature in SQL Server 2017:
A best practice is to partition your ETL process in child packages that are orchestrated by a master package using the Execute Package Task (EPT). SSIS scale-out can run packages with EPT but it does not scale out the EPT packages execution on another machine. If you have a main package, which as various sub package execution with EPT, the package and all EPT sub package execution will run on the same worker machine, while other workers in your scale out cluster can handle other packages that are independent. If some order/dependency is needed, there will be extra work needed from you to design a master package on purpose (i.e. one master package to control the overall flow and trigger execution in Scale-out and wait for the result accordingly).
If you opt for the ELT pattern as I suggested, scaling out might not help all that much. Your gain will depend on where the performance bottleneck is. If the bottleneck is already in the database, scaling out ETL across multiple nodes will be a futile effort. But if the bottleneck is not the database, then the scale-out can still help to take advantage of multiple machines.
When a package is scheduled in scale-out, by default it is possible for it to be assigned to any worker node to be executed. But if needed, you can also specify which worker node(s) you want the package execution to be assigned to when triggering the execution. The master node doesn’t monitor the worker utilization. Instead the worker node does its own CPU or Memory’s monitoring and tells the master if it can take more packages.
https://prologika.com/wp-content/uploads/2016/01/logo.png00Prologika - Teo Lachevhttps://prologika.com/wp-content/uploads/2016/01/logo.pngPrologika - Teo Lachev2017-06-11 16:54:172017-06-11 16:54:17Scaling out SSIS in SQL Server 2017
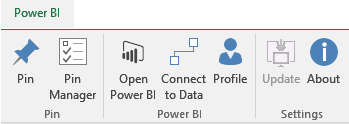
Issue: You want to use the Power BI Excel Publisher but it doesn’t load. You look at the Excel add-ins and you see that it’s deactivated. You try to activate it and then you get an error.
Solution: Copy the following Office PIA files to the add-in folder (C:\Program Files\Microsoft Power BI Publisher for Excel\bin).
Microsoft.Office.Interop.SQLIS.12.0.nupkg
OFFICE.dll
Unfortunately, I don’t know where these files are located. They were given to me by the Microsoft Support and I can’t redistribute. If you can’t find them, you can call MS support and reference support case: 117041015581533.
Now when you open Excel, you should see the Power BI ribbon tab.