Power BI vs. Tableau (Part 3)

Feeling the heat, Tableau has come up with an updated Power BI vs. Tableau battle card as one of my clients pointed out. This time designed as a video. I guess the previous “10 Ways Power BI Falls Short” slide deck, which I discussed in the part 1 and part 2 of my “Power BI vs. Tableau” blog , wasn’t effective enough. I concur given the large number of customers abandoning the tool. Tableau is desperately trying to breathe new life into their aging software by a series of acquisitions to stay competitive but they’re now fighting an uphill battle. And their marketing materials should have a timestamp because Power BI improves every month and points get outdated quickly (see the first part 1 of my blog).
But let’s take a look at the latest battle card so we are better positioned to answer the question asked by Tableau “Which one helped me answer my questions faster?”
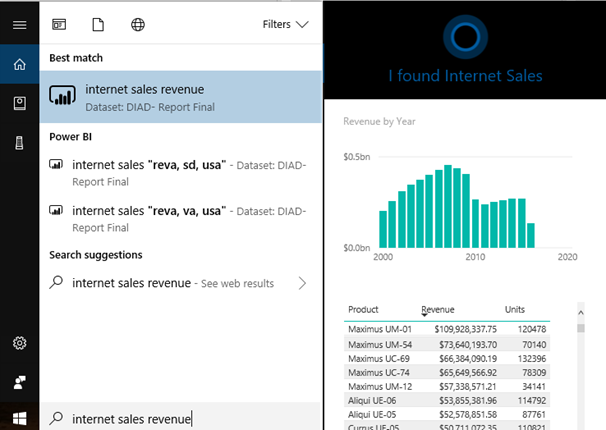
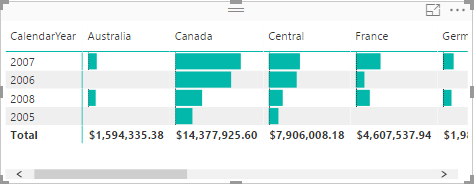
- 2:17 minute – Tableau shows a bar multiple by Year and Region, with the narrative “it’s surprising that other tools can’t do that”. Here is a similar visual with Power BI.

- 4:00 minute – Maps. OK, Tableau is very excited about lassoing points on the map like it’s the Holy Grail of geospatial analytics. What about other features that in my opinion are more important, such as using authoritative spatial data, like ArcGIS? Because Tableau its proprietary visualization framework that doesn’t natively support plugins, this is what you have to do to get it with Tableau integrated with ArcGIS. With Power BI, it’s built in a custom visual, which by the way supports lassoing. So, which one helped me answer my questions faster?
- 5:30 minute — The high-density outlier pitch. Alas, this time isn’t taking the central stage. As explained here, as of 9/30 all Power BI visuals except maps are high density so it’s a mute point. UPDATE 1/8/2017: As of the December 2017 update of Power BI, maps are high-density too.
- 7:11 minute – Tableau pitches that the tool can connect to lots of, lots of data but shows less connectors than Power BI. Power BI has 80 connectors and more are added every month.
- 8:00 minute – Tableau discusses collaboration and how easy it should be to share with coworkers by deploying to on-premises Tableau server. Well, I’d argue that it’s easier to deploy to the cloud, or even better, give the user the choice to deploy to a PaaS platform or to on-premises server. I also find it amusing that a tool that was once considered a “gold standard” for data visualization has run out of visualization strengths, and harps on collaboration from this point on.
- 10:00 minute – I’m losing the pitch as Tableau is demonstrating how dashboards have full fidelity when published. So, do Power BI reports.
- 11:00 minute – Recipients personalizing shared reports and dashboards by creating views. Tableau has a point here, the Power BI sharing story needs consistency. Previously, organizational content packs allowed users to create personal read-write copies but apps, which supersede content packs, don’t have this feature (they are read-only to the recipient). About filtering, users can pass filters on the report URL. And users can create reports from scratch if they have access to the dataset, such as members of a workspace.
- 13:12 minute – Sandboxing and lifecycle management. The current Power BI Service story is to use workspaces for different environments, but Power BI Premium would most likely improve on this. On premises, you can use DEV and QA report servers which don’t require licensing. Try to get a free server with Tableau for QA/DEV!
- 14:00 minute – Auditing. Power BI supports usage metrics on report and dashboard level. Power BI also has comprehensive and integrated auditing with Office 365.
- 15:00 minute – More pitch about the Tableau Server governance. Well, SSRS/Power BI Report Server had this for a long time. But it also supports SSRS traditional reports, Excel reports, and Power BI reports. Speaking of a centralized report management, can you deploy anything else than Tableau reports to the Tableau report server, so it becomes an enterprise report portal for different report types?
- 16:00 minute – More about auditing. SSRS/Power BI Report Server has an execution log for this.
Then at the bottom of the page, we have a study by someone ex-Gartner, citing lower TCO for Tableau compared to Power BI. I can’t be reading this right. From the Gartner’s 2017 Magic Quadrant for Business Intelligence and Analytics Platforms, “On an annualized basis, Microsoft Power BI is roughly one-third of the license cost of a three-year perpetual BI license, but 80% lower than other cloud BI products. Low total cost of ownership was cited as the second most important reason for reference customers choosing Microsoft Power BI.” Yet, this researcher has found that “Microsoft Power BI’s total cost of ownership (TCO) to be 29% higher than Tableau”? Pick who to trust. And should business users deal with 20 GB datasets to start with? What about the novel idea of putting all of this data into a centralized semantic layer so we don’t have datasets moving around? Wait, isn’t a Tableau model limited to a single dataset with “data blending” capabilities? What’s the TOC then for all these isolated Tableau spreadmarts?
When you talk to Tableau about Power BI, get them to answer also the points I made in Part 2 of “Power BI vs. Tableau” blog.