I’m excited to announce the fourth edition of my Applied Microsoft Power BI book! When the original book was published in January 2016, it was the first Power BI book at that time and it had less than 300 pages. Since then, I helped many companies adopt or transition to Power BI and taught hundreds of students. It’s been a great experience to witness the momentum surrounding Power BI and how the tool matured over time. As a result, the book got thicker too and it now stands at 500 pages. However, I believe what’s more important is that this book provides systematic, yet dependent, view by showing what Power BI can do for four types of users (business users, analysts, pros, and developers).
This is the only Power BI book that gets annual revisions to keep it up to date with this ever changing technology! Because I had to draw a line somewhere, Applied Microsoft Power BI (4th edition) covers all features that are in preview or released by December 2018. As with my previous books, I’m committed to help my readers with book-related questions and welcome all feedback on the book discussion forum on the book page. While you are there, feel free to check out the book resources (sample chapter, front matter, and more). I also encourage you to follow my blog at https://prologika.com/blog and subscribing to my newsletter at https://prologika.com to stay on the Power BI latest.
Bring your data to life for the forth time! Keep on reading, learning, and Happy New Year!
https://prologika.com/wp-content/uploads/2016/01/logo.png00Prologika - Teo Lachevhttps://prologika.com/wp-content/uploads/2016/01/logo.pngPrologika - Teo Lachev2018-12-31 08:34:392018-12-31 23:50:43Applied Power BI Book (4th Edition)
Power BI lets you share content directly with external users for B2B and B2C scenarios. When the benefits of this sharing option outweigh its limitations (read-only reports, requiring Azure AD federated access, per-user licensing, rendering the report inside Power BI), this is the easiest way to share Power BI content with an external party. However, the documentation, which is otherwise excellent, doesn’t explain the steps required to allow the external user to see only a subset of data when you have a dataset configured for data (RLS) security.
Granting access to an external user to a dataset configured for data security is like the proverbial chicken and egg problem. To grant access to the report, you need to share the report with the user, but you can’t add the user to the security role because the user is not provisioned yet. Hence, you’ll first share a non-sensitive report with the user before you share the actual report.
Create an organizational workspace. I recommend you create a v2 workspace for the benefits I outlined in my “Power BI Sharing Is Getting Better” blog.
In Power BI Desktop, import some sample data that is OK for the end user to see. Create a simple report for testing. A dataset is required because for some obscure reason, Power BI will prevent you from sharing an empty report that doesn’t have a dataset. Publish the Power BI Desktop file to powerbi.com.
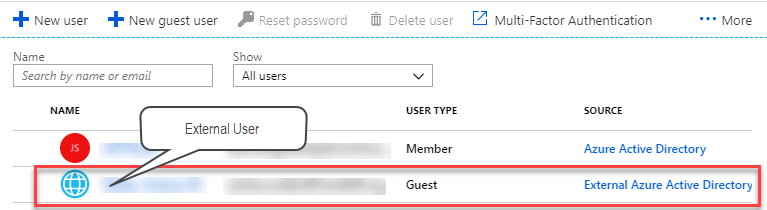
Share the non-sensitive report with the external user. At this point, if you examine the user account in Azure Active Directory in the Azure Portal (portal.azure.com), it will show that the user is invited.
When the user gets the email, clicks the link, and navigates the prompts, the user will be eventually added to your tenant’s Active Directory and will show as Guest in the External Azure Active Directory source.
Now you can assign a Power BI Pro license to this user in the Azure Portal. Remember that unless you are on Power BI Premium, any form of sharing requires a Power BI Pro license. One gotcha here is that the Azure Portal might refuse assigning a Power BI Pro license with the following error “License cannot be assigned to a user without a usage location specified.” To fix this horrible issue, go to Azure Active Directory (Users tab), click the external user, click Edit in the Settings section in the user profile, and then use the “Usage location” drop-down to select the country where the user is located.
At this point, the external user is added to your tenant’s active directory and covered by Power BI Pro license. Next, publish the actual Power BI Desktop file with the sensitive report you want to share. This file should have a role that applies a row filter to one or more tables to enforce data security in a multi-tenant dataset. Once the file is published to powerbi.com, go to the dataset Security setting and add the external user to the role by typing the user’s email.
The last step is to share the report with the external user.
TIP: If you have a lot of external users, consider assigning them to a security group so you can grant access to the group instead of individual emails. Also, instead of sharing individual reports and dashboards, use Apps to grant access to the security groups. Note that as I explained in the “Power BI Sharing Is Getting Better” blog, currently you can’t assign viewers as members of the workspace. You must use either dashboard/report sharing or apps.
https://prologika.com/wp-content/uploads/2016/01/logo.png00Prologika - Teo Lachevhttps://prologika.com/wp-content/uploads/2016/01/logo.pngPrologika - Teo Lachev2018-12-28 15:59:532018-12-28 15:59:53Power BI External Users and Data Security
Bring your data to life today and learn how Power BI changes the way everyone gains insights from data.
Publication date: 1/1/2019
Size: 474 pages, 7.5″ x 9.25″
Price: $49.99
ISBN 10: 0-9766353-9-9
ISBN 13: 978-0-9766353-9-0
Introduces information workers, data analysts, IT pros, and developers to Microsoft Power BI — a cloud-hosted, business intelligence and analytics platform that democratizes and opens BI to everyone, making it free to get started!
Power BI changes the way you gain insights from data; it brings you a cloud-hosted, business intelligence and analytics platform that democratizes and opens BI to everyone. It does so under a simple promise: “five seconds to sign up, five minutes to wow!”
Synopsis
An insightful tour that provides an authoritative yet independent view of this exciting technology, this guide introduces Microsoft Power BI—a cloud-hosted, business intelligence and analytics platform that democratizes and opens BI to everyone, making it free to get started!
Information Workers will learn how to connect to popular cloud services to derive instant insights, create interactive reports and dashboards, and view them in the browser and on the go! Data Analysts will discover how to integrate and transform data from virtually everywhere and then implement sophisticated self-service models. The book also teaches BI and IT Pros how to establish a trustworthy environment that promotes collaboration, and they’ll implement Power BI-centric solutions for descriptive, real-time, and predictive analytics. Developers will find out how to integrate custom applications with Power BI, to embed reports, and to implement custom visuals to effectively present any data.
Ideal for both experienced BI practitioners and beginners, this book doesn’t assume you have any prior data analytics experience. It’s designed as an easy-to-follow guide that introduces new concepts with step-by-step instructions and hands-on exercises.
What’s inside
Get insights from popular cloud services on any device!
Implement sophisticated personal BI models!
Enable team BI and implement descriptive, predictive, and real-time BI solutions!
Extend Power BI with custom visuals and report-enable custom apps! …and much more!
“The true power in Power BI cannot be appreciated without understanding what the offering can do and how to best use it. That is why resources like this fantastic book will become instrumental for you. This book starts by providing an overview of the foundational components of Power BI. It introduces Power BI Desktop, data modeling concepts, building reports, publishing and designing dashboards. Readers will be up and running in no time. It then moves on to bring you up to speed on deeper dive topics such as data gateways, data re-fresh, streaming analytics, embedding and the Power BI data visualization API. Not only is Teo one of the first people in the world to learn and write about Power BI 2.0, he also brings a wealth of knowledge from deploying the first real-world implementations. Much like Teo’s previous books on Analysis Services and Reporting Services, this Power BI book will be a must read for serious Microsoft professionals. It will also empower data analysts and enthusiasts everywhere.”
Jen Underwood Principal Program Manager, Microsoft Business Intelligence
“I’m impressed about the breadth of the topics covered by Teo Lachev in this book, I’ve just took a quick look at every chapter, and Teo covered all the topics at least at the point where you can start doing something (and in some chapter also more than just an intro). Considering the speed of Power BI releases and the effort required in writing a book, I know the huge effort behind this. My kudos to this book!”
https://prologika.com/wp-content/uploads/2017/12/apbi4.png301229Prologika - Teo Lachevhttps://prologika.com/wp-content/uploads/2016/01/logo.pngPrologika - Teo Lachev2018-12-24 16:36:562021-02-16 01:56:10APPLIED MICROSOFT POWER BI (4th Edition) (BRING YOUR DATA TO LIFE!)
Happy Holidays! I hope you’re enjoying this special time of the year. According to Gartner, “poor data quality is hitting organizations where it hurts – to the tune of $15 million as the average annual financial cost in 2017″. Data integration is another huge challenge, you know it and I know it. Microsoft hopes that Power BI dataflows will help data analysts tackle these issues and dataflows are the subject of this newsletter. But before I give you my opinion about this newcomer, I’m excited to announce the availability of the fourth edition of my “Applied Microsoft Power BI” book – the only Power BI book that it’s updated every year to keep it up with the ever-changing world of Power BI and the Microsoft Data Platform! The book is making slowly its way to the retailers and it should be available on Amazon in the first days of 2019.
What’s a dataflow?
I’m sure that by now you’ve heard about Power Query – a tool that is integrated with Power BI Desktop to help the data analyst clean and shape the data. The issue with the Power Query though is that it’s tightly coupled with Power BI Desktop while data integration challenges sometimes need to be solved at a larger scale. Think of dataflows as “Power Query in the Cloud”. Dataflows is to self-service BI what ETL is to Power BI pros.
A dataflow is a collection of Power Query queries, also known as entities, and it lives in a Power BI organizational workspace.
For example, if I want to stage data from Salesforce, I can create a dataflow with as many entities as Salesforce tables I want to stage. Unlike Power Query, which can only output to a table in a data model, a dataflow saves its output as a pair of a CSV file (data) and JSON file (metadata) in a Microsoft provided data lake store.
So, for the BI pros who are familiar with SSIS projects for ETL, think of a dataflow as a project and queries as SSIS packages. Just like you can deploy an SSIS project and schedule it to run at a specific time, you can schedule a dataflow, and this will execute all its queries.
The Good
There is a lot to like about dataflows. I can think of two primary self-service scenarios that can benefit from dataflows:
Data staging – Many organizations implement operational data stores (ODS) and staging databases before the data is processed and loaded in a data warehouse. As a business user, you can use data-flows for a similar purpose. For example, one of our clients is a large insurance company that uses Microsoft Dynamics 365 for customer relationship management. Various data analysts create data models from the same CRM data, but they find that refreshing the CRM data is time consuming. Instead, they can create a dataflow to stage some CRM entities before importing them in Power BI Desktop. Even better, you could import the staged CRM data into a single dataset or in an organizational semantic model to multiple data copies and duplicating business logic.
Certified datasets – One way to improve data quality and promote better self-service BI is to prepare a set of certified common entities, such as Organization, Product, and Vendor. A data steward can be responsible for designing and managing these entities. Once in place, data analysts can import the certified entities in their data models.
There is a solid architecture, vision, and investments behind dataflows. You create dataflows using a tool that you’re already familiar with: Power Query. If you know Power Query, you know dataflows. Microsoft has provided the data lake storage and pricing is included in Power BI Pro/Power BI Premium. So, you have everything you need to get started with dataflows today. Ingesting the dataflow output is very fast too because you import CSV files.
The Bad
My blog on same subject started with positioning as I was left with the impression from watching the MS presentations that Microsoft encourages business users to consider dataflows for any data integration task, from data staging to loading data warehouses and even replacing data warehouses and ETL (heard that vibe before?) But Matthew Roche clarified that “dataflows don’t replace data warehouses and ETL any more than Power BI desktop replaces a full set of BI pro tools. Dataflows complement these pro tools, and enable users who are not BI pros to fill in more gaps in a BI solution, similar to other Power BI capabilities. Although dataflows mean that self-service users can do more without help, the same patterns still apply”. So, consider this if you hear a different propaganda and use the right tool for task at hand.
You need Power BI Premium to realize the full potential of dataflows. For some obscure reason, features like linked and computed entities are not available in Power BI Pro. I wonder how many customers will feel pushed to go Power BI Premium as more and more features are only available there. I don’t mind scalability and performance related features but incremental refresh and linked entities?
Lastly, the CSV output is both a blessing and a curse. True, ingestion is fast, but text files are not a relational database. Business users can’t make direct changes to the staged data. Further, the only option is to import the dataflow output in Power BI as DirectQuery is not available for text files.
The Ugly
As dataflows stand today (in preview), you (almost) can’t access directly the output generated by dataflows. This precludes the continuum between self-service and organizational worlds. For example, IT might need to import a certified dataset into a data warehouse. But you can only connect to a dataflow in Power BI Desktop because the CSV files are not directly accessible. True, Power BI Premium lets you bring your own data lake storage (currently a preview feature), but a better option in my opinion was to provide access to the raw data in both Power BI Pro and Premium given that this is your data lake and your data.
Introduces information workers, data analysts, IT pros, and developers to Microsoft Power BI — a cloud-hosted, business intelligence and analytics platform that democratizes and opens BI to everyone, making it free to get started!
Power BI changes the way you gain insights from data; it brings you a cloud-hosted, business intelligence and analytics platform that democratizes and opens BI to everyone. It does so under a simple promise: “five seconds to sign up, five minutes to wow!”
“That is why resources like this fantastic book will become instrumental for you!” Jen Underwood Principal Program Manager Microsoft Business Intelligence
Synopsis
An insightful tour that provides an authoritative yet independent view of this exciting technology, this guide introduces Microsoft Power BI—a cloud-hosted, business intelligence and analytics platform that democratizes and opens BI to everyone, making it free to get started!
Information Workers will learn how to connect to popular cloud services to derive instant insights, create interactive reports and dashboards, and view them in the browser and on the go! Data Analysts will discover how to integrate and transform data from virtually everywhere and then implement sophisticated self-service models. The book also teaches BI and IT Pros how to establish a trustworthy environment that promotes collaboration, and they’ll implement Power BI-centric solutions for descriptive, real-time, and predictive analytics. Developers will find out how to integrate custom applications with Power BI, to embed reports, and to implement custom visuals to effectively present any data.
Ideal for both experienced BI practitioners and beginners, this book doesn’t assume you have any prior data analytics experience. It’s designed as an easy-to-follow guide that introduces new concepts with step-by-step instructions and hands-on exercises.
What’s inside
Get insights from popular cloud services on any device!
Implement sophisticated personal BI models!
Enable team BI and implement descriptive, predictive, and real-time BI solutions!
Extend Power BI with custom visuals and report-enable custom apps! …and much more!
“The true power in Power BI cannot be appreciated without understanding what the offering can do and how to best use it. That is why resources like this fantastic book will become instrumental for you. This book starts by providing an overview of the foundational components of Power BI. It introduces Power BI Desktop, data modeling concepts, building reports, publishing and designing dashboards. Readers will be up and running in no time. It then moves on to bring you up to speed on deeper dive topics such as data gateways, data re-fresh, streaming analytics, embedding and the Power BI data visualization API. Not only is Teo one of the first people in the world to learn and write about Power BI 2.0, he also brings a wealth of knowledge from deploying the first real-world implementations. Much like Teo’s previous books on Analysis Services and Reporting Services, this Power BI book will be a must read for serious Microsoft professionals. It will also empower data analysts and enthusiasts everywhere.”
Jen Underwood Principal Program Manager, Microsoft Business Intelligence
“I’m impressed about the breadth of the topics covered by Teo Lachev in this book, I’ve just took a quick look at every chapter, and Teo covered all the topics at least at the point where you can start doing something (and in some chapter also more than just an intro). Considering the speed of Power BI releases and the effort required in writing a book, I know the huge effort behind this. My kudos to this book!”
Buy the paper copy from Amazon Buy the Kindle ebook from Amazon
https://prologika.com/wp-content/uploads/2017/12/apbi3.png301229Prologika - Teo Lachevhttps://prologika.com/wp-content/uploads/2016/01/logo.pngPrologika - Teo Lachev2018-12-20 10:00:372021-02-17 01:02:04APPLIED MICROSOFT POWER BI (3rd Edition) (BRING YOUR DATA TO LIFE!)
If you have used SSRS, you know that paginated reports are very customizable, and you can make almost any property expression-based. Power BI is yet to deliver expression-based properties to change settings based on runtime condition, such as to change the font style based on the actual value or user selection. Currently, there are two places where you can use a DAX measure for expression-based formatting of colors:
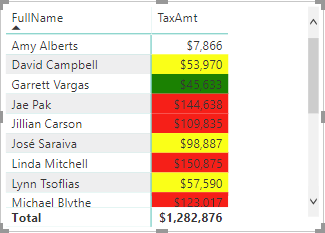
Conditional formatting
You can use a DAX measure to change the fore color or background color when you apply conditional formatting to cells in Table and Matrix reports. To do so, when you configure the conditional formatting settings, choose the Field Value option. In the following report, I used a DAX measure to format the TaxAmount field with the following formula:
Although the measure defines three bands of colors, which you can do by just using rules, it can also check additional runtime conditions, such as what field is used on the report or what value the user has selected in a slicer. You can also specify custom colors by using the hex triplet notation, such as #00AA09.
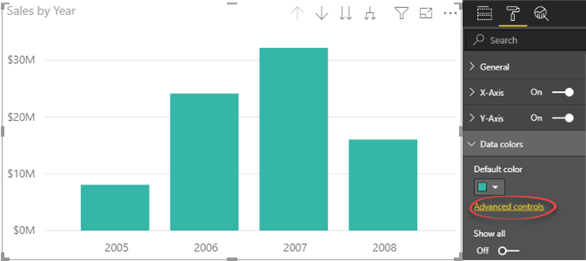
Chart data colors
Some charts with single data series, such as column and bar charts, support “Advanced controls” in the “Data colors” section of the Format tab in the Visualizations pane. This link brings you to the same window that you use to configure conditional formatting and you can use the “Field value” option to choose a DAX measure.
https://prologika.com/wp-content/uploads/2016/01/logo.png00Prologika - Teo Lachevhttps://prologika.com/wp-content/uploads/2016/01/logo.pngPrologika - Teo Lachev2018-12-15 15:34:062018-12-15 15:35:32Expression-based Formatting in Power BI
If you’re a BI architect responsible for designing Azure-based cloud BI solutions and you’re not following the James Serra’s blog, you’re missing a lot. Previously an independent consultant and MVP, James works now as a Big Data/Data Warehouse Evangelist at Microsoft. I can’t agree more with his latest blog “Should I load structured data into my data lake?”
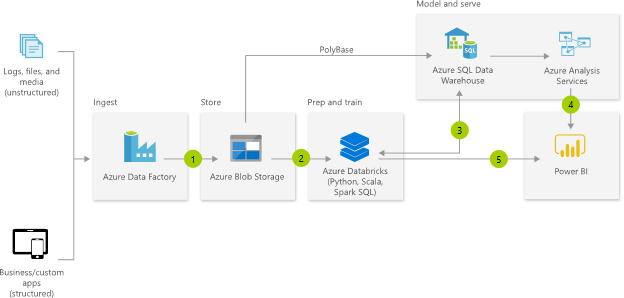
We’ve heard a lot lately about what the “modern” data warehouse architecture should look like from Microsoft and other vendors. Here is the diagram taken from, you guessed it, the Microsoft Modern Data Warehouse page.
The problem is that many organizations take this diagram verbatim when it makes sense and when it doesn’t. For example, a client exports data from on-premises relational databases to text files in Azure Data Lake, only to load it later in a cloud data warehouse. To my observation that this is redundant and pointless, they answered that I shouldn’t deemphasize the “whole Big Data” architecture should one day their users decide to do machine learning. To my observation that should this moment arrive, data scientists will benefit more if the data is readily accessible in a relational database, they said that it contradicts what Microsoft recommended.
Of course, this “modern” architecture makes a lot of sense to the vendor (it’s a nice and perpetual revenue stream) or the consulting partner (the more stuff, the higher the bill) but more than likely is an overkill for you. Here are the most common issues I see organizations making on their BI journey to the cloud:
Excessive data movement – The more you move the data, the more problems. You know it and I know it. Data quality issues, latency, maintenance and endless troubleshooting, etc. In another case, I saw a Cosmos DB sneaked in between, just in case there is too much structure in the source data.
Architecture “gold plating” – A classic example, which the diagram perpetuates, is Azure SQL Data Warehouse. If you have a few million rows of data in your data center, would you buy Teradata? Of course, you wouldn’t! Now, just because you can afford the monthly premium for Azure SQL Data Warehouse, why would you go for an MPP platform? Not to mention that more than likely you’d have to redo your entire ETL if you are migrating from premises as there is still no T-SQL parity. I wouldn’t even consider Azure SQL Data Warehouse for workloads less than 1 TB. And not even then because a semantic model will probably do the heavy lifting. And on ETL, where Microsoft recommends ADF, read my thoughts on it here.
Migrating to the cloud to save cost – No vendor would let its cloud (or whatever) alternative cannibalize another offering. For me, your primary goal for migrating to the cloud should be not cost savings but reliability and convenience. Try to get your IT department to promise SLA or promise anything for that matter. Or provision a VM in minutes? Cost alone, more than likely you’ll spend more moving to the cloud, especially if you go PaaS. For example, a client found that their bill went up astronomically because each BI PaaS offering (Database Engine, Analysis Services, ETL, Power BI) has its own pricing compared to covering all of these with a single SQL Server EE license in their data center. The “modern” architecture above could easily run $50,000/mo which is what a perpetual SQL Server EE license will cost you but over years.
They asked a famous writer one day when he knows that the manuscript is done, and he said when there is nothing more to take out. This principle should apply to BI architectures too. What can you take out to meet the business requirements without overcomplicating? It does cost a lot to be “modern”.
https://prologika.com/wp-content/uploads/2016/01/logo.png00Prologika - Teo Lachevhttps://prologika.com/wp-content/uploads/2016/01/logo.pngPrologika - Teo Lachev2018-11-28 21:51:382018-11-29 08:22:56Are You Modern Yet?
MS BI fans, join us for the next Atlanta MS BI and Power BI Group meeting on December 3th, Tuesday at 6:30 PM at the Microsoft office in Alpharetta. I will discuss Power BI dataflows. A3 will sponsor the event. For more details, visit our group page and don’t forget to RSVP (use the RSVP survey on the main page) if you’re planning to attend.
Presentation:
Understanding Power BI Dataflows
Date:
December 3, 2018, Monday
Time
6:30 – 8:30 PM ET
Place:
Microsoft Office (Alpharetta)
8000 Avalon Boulevard Suite 900 Alpharetta, GA 30009
Overview:
If you’re a business user, you might know about Microsoft Flow. If you’re a BI pro, you might have used the SSIS Control Flow and Data Flow. But do you know about the Power BI dataflow? Data preparation is often the most labor-intensive component of an analytics project and getting this right is vital if the results are to be accurate. While the growth of self-service BI has empowered users to answer important questions, ensuring well managed data is available to all employees remains one of businesses biggest challenges. Requiring no additional cost, dataflows are a building block of the Power BI ecosystem, providing a no-code/low-code approach using Power Query to create curated datasets that can be easily consumed by business analysts. Attend this presentation and you’ll learn:
How to stage data with dataflows
How dataflows can be used to create curated datasets
How dataflows can be created with the click of a button, ingesting data from many well knows SAAS solution, such as Dynamics and Salesforce
More advanced integration scenarios with Power BI Premium
Speaker:
Through his Atlanta-based company Prologika (https://prologika.com), a Microsoft Gold Partner in Data Analytics, Teo Lachev helps organizations make sense of their most valuable asset: their data. His strategy formulation, trusted advisory and mentoring, design and implementation services empower clients to apply effectively data analytics in order to understand, improve, and transform their business processes. Teo has authored and co-authored several bestselling books on organizational and self-service data analytics, and he has been leading the Atlanta Microsoft BI and Power BI group since he founded it in 2010. Teo has been a Microsoft Most Valued Professional (MVP) Data Platform since 2004.
Sponsor:
A3 Solutions is the developer of A3 Modeling. Empower your finance team with the only tool that supercharges end-user Excel into Enterprise Excel. Why incur the risk and cost to replace your Excel models? Just add A3! The San Francisco-based company’s product is in use at some of the world’s largest manufacturers, financial firms and retailers including Honda Manufacturing, Williams Sonoma, T.Rowe Price, and Fox TV, in addition to many mid-sized organizations. http://www.a3solutions.com/
Prototypes with Pizza
“New relationship view, paginated reports, and filter pane” by Teo Lachev
https://prologika.com/wp-content/uploads/2016/01/logo.png00Prologika - Teo Lachevhttps://prologika.com/wp-content/uploads/2016/01/logo.pngPrologika - Teo Lachev2018-11-26 21:37:562021-02-17 01:01:58Atlanta MS BI and Power BI Group Meeting on December 3th
This blog is an update of my previous blog “Common Data Service for Analytics: The Good, the Bad, the Ugly“. Things have changed in the past 6 months. The Common Data Service for Analytics is no more. It got superseded by Power BI dataflows, which Microsoft officially introduced at the PASS Summit last week.
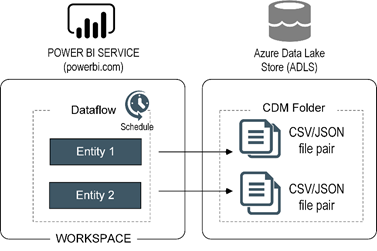
Think of dataflows as “Power Query in the Cloud”. Dataflows is to self-service BI what ETL is to Power BI pros.
A dataflow is a collection of Power Query queries, also known as entities, and it lives in a Power BI organizational workspace. For example, if I want to stage data from Salesforce, I can create a dataflow with as many entities as Salesforce tables I want to stage. Unlike Power Query, which can only output to a table in a data model, a dataflow saves its output as a pair of a CSV file (data) and JSON file (metadata) in Azure Data Lake Store (ADLS).
The Good
There is a lot to like about dataflows. I can think of two primary self-service scenarios that can benefit from dataflows:
Data staging – Many organizations implement operational data stores (ODS) and staging databases before the data is processed and loaded in a data warehouse. As a business user, you can use data-flows for a similar purpose. For example, one of our clients is a large insurance company that uses Microsoft Dynamics 365 for customer relationship management. Various data analysts create data models from the same CRM data, but they find that refreshing the CRM data is time consuming. Instead, they can create a dataflow to stage some CRM entities before importing them in Power BI Desktop. Even better, you could import the staged CRM data into a single dataset or in an organizational semantic model to multiple data copies and duplicating business logic.
Certified datasets – One way to improve data quality and promote better self-service BI is to prepare a set of certified common entities, such as Organization, Product, and Vendor. A data steward can be responsible for designing and managing these entities. Once in place, data analysts can import the certified entities in their data models.
There is a solid architecture, vision, and investments behind dataflows. You create dataflows using a tool that you’re already familiar with: Power Query. If you know Power Query, you know dataflows. Microsoft has provided the data lake storage and pricing is included in Power BI Pro/Power BI Premium. So, you have everything you need to get started with dataflows today. Ingesting the dataflow output is very fast too because you import CSV files.
The Bad
Let’s start with positioning. I’ve heard Microsoft position dataflows for any data integration task, from data staging to loading data warehouses and even replacing data warehouses and ETL (heard that vibe before?) I’ve seen business users doing impressive things with Power BI. But I’ve seen them also attempting to implement organizational solutions that collapse from their own weight. Dataflows are not an exception and I don’t think it’s a business user’s job to tackle ambitious data integration tasks.
You need Power BI Premium to realize the full potential of dataflows. For some obscure reason, features like linked and computed entities are not available in Power BI Pro. I wonder how many customers will feel pushed to go Power BI Premium as more and more features are only available there. I don’t mind scalability and performance related features but incremental refresh and linked entities?
The CSV output is both a blessing and a curse. True, ingestion is fast but text files are not a relational database. For example, the only option is to import the dataflow output in Power BI as DirectQuery is not available for text files.
The Ugly
You (almost) can’t access directly the output generated by dataflows. This precludes the continuum between self-service and organizational worlds. For example, IT might need to import a certified dataset into a data warehouse. But you can only connect to a dataflow in Power BI Desktop because the CSV files are not accessible. Power BI Premium will let you bring your own data lake storage in near future but a better option in my opinion was to provide access to the raw data in both Power BI Pro and Premium given that this is your data lake and your data.
https://prologika.com/wp-content/uploads/2016/01/logo.png00Prologika - Teo Lachevhttps://prologika.com/wp-content/uploads/2016/01/logo.pngPrologika - Teo Lachev2018-11-16 21:42:322018-11-16 21:42:32Dataflows: The Good, the Bad, the Ugly
MS BI fans, join us for the next Atlanta MS BI and Power BI Group meeting on October 30th, Tuesday at 6:30 PM at the Microsoft office in Alpharetta. Neal Waterstreet will tackle the important and pervasive issue of bad data quality. ZAP BI will sponsor the event. And your humble correspondent will introduce you to Power BI Home and data profiling. For more details, visit our group page and don’t forget to RSVP (use the RSVP survey on the main page) if you’re planning to attend.
Presentation:
Data Quality – Plain and Simple
Date:
October 30, 2018, Tuesday
Time
6:30 – 8:30 PM ET
Place:
Microsoft Office (Alpharetta)
8000 Avalon Boulevard Suite 900 Alpharetta, GA 30009
Overview:
Data quality is a subject that comes up repeatedly in many organizations. Most executives are concerned about the quality of the information used in their decisions. We talk about “good data” and “bad data” but what do those terms mean? In this presentation, we will first define what data quality is and look at how to measure it with data quality dimensions. Then, we’ll explore common causes for data quality issues and how to perform a data quality assessment. Finally, we’ll review the results and discuss some strategies and tools that can help improve the quality of the data in your organization.
Speaker:
Neal Waterstreet is a BI Architect/Consultant with Prologika (https://prologika.com) ad he has more than 20 years of industry experience. Neal is skilled in the entire BI spectrum, including dimensional modeling, ETL design and development using Integration Services (SSIS), designing and developing multidimensional cubes and Tabular models using Analysis Services (SSAS) and Master Data Management using Microsoft Data Services (MDS). He’s also involved with the database community with the Atlanta BI and Power BI User Group and the Atlanta Modern Excel User Group.
Sponsor:
ZAP’s mission is clear: to connect your business with data. Game-changing insight that impacts business performance only happens when you analyze data by business process or team objective, as opposed to by file type or IT system. This is what ZAP enables. https://www.zapbi.com/
Prototypes with Pizza
“Power BI Home and data profiling” by Teo Lachev
https://prologika.com/wp-content/uploads/2016/01/logo.png00Prologika - Teo Lachevhttps://prologika.com/wp-content/uploads/2016/01/logo.pngPrologika - Teo Lachev2018-10-25 13:15:012021-02-17 01:01:58Atlanta MS BI and Power BI Group Meeting on October 30


 Bring your data to life today and learn how Power BI changes the way everyone gains insights from data.
 Happy Holidays! I hope you’re enjoying this special time of the year. According to
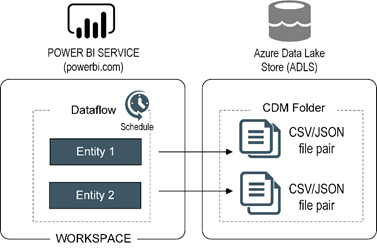

 Bring your data to life today and learn how Power BI changes the way everyone gains insights from data.