5 Tools for Understanding BISM Storage
Recall that the Microsoft BI Semantic Model consists of three flavors: Multidimensional, Tabular, and Power Pivot. The default storage mode of Tabular and Power Pivot is the xVelocity in-memory engine. The default Multidimensional storage is MOLAP. You might want to analyze which objects consume the most storage space. This especially important for Tabular since computer memory is still a scarce resource.
Windows Explorer
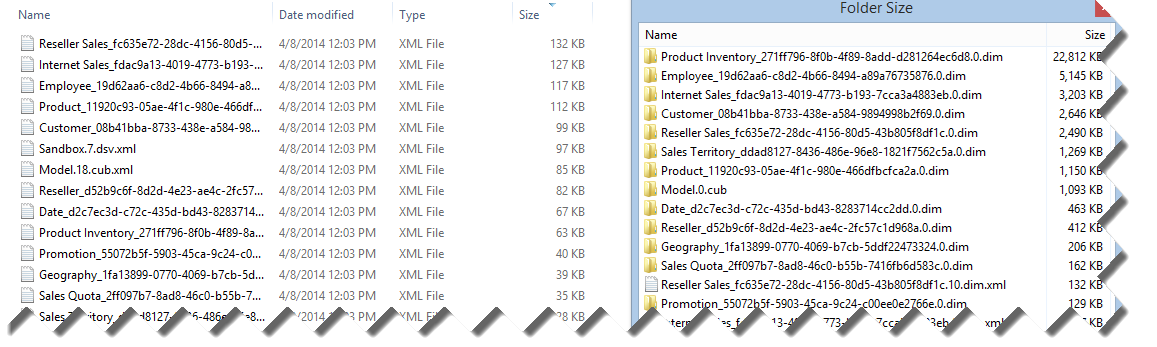
The easiest way to get the storage breakdown for Multidimensional and Tabular is to use Windows Explorer and examine the size of the corresponding data folder under the SSAS Data folder, e.g. C:\Program Files\Microsoft SQL Server\MSAS11.TABULAR\OLAP\Data\AdventureWorks Tabular Model SQL 2012.0.db. Unfortunately, Windows Explorer in Windows 7 and 8 doesn’t show the folder size requiring you either to hover on the folder to see its size or to go the folder properties. As a workaround, consider utilities such as HDGraph or Folder Size. Folder Size, for example, pops up a window in Windows Explorer on the side of each folder that has subfolders to show you the folder size. In the case of the AdventureWorks Tabular Model SQL 2012 Tabular database, we can see that Product Inventory table consumes the most space.
If you drill down the Product Inventory folder and sort by size, you can see the storage breakdown by column.
BISM Server Memory Report
Another way to analyze Tabular and Multidimensional storage in an user-friendly way is to use the BISM Server Memory Report developed by Kasper de Junge (Senior Program Manager at Microsoft).
DMV Views
Behind the scenes, the BISM Server Memory Report uses SSAS DMV Views which expose expose information about local server operations and server health. Specifically, it uses the Discover_object_memory_usage DMV which you can query directly to obtain the same information.

Power Pivot Macro
If you use Power Pivot, the easiest way to analyze Power Pivot storage in Excel 2013 is to use the Power Pivot macro made available by Kasper de Junge. When you run the macro, it generates Excel pivot report which you can sort by the object memory size. For example, the report below allows us to see the most memory is consumed by CalculatedColumn1 (although xVelocity calculated columns are stored to disk like regular columns, calculated columns are not compressed).

Power Pivot PowerShell Script
While the above macro relies on Excel 2013 native integration with Power Pivot and only works with Excel 2013, the methodology and PowerShell script developed by Vidas Matelis (SQL Server MVP) works with both Excel 2010 and 2013.


