Announcing Sparkline Visual
A sparkline is a miniature graph, typically drawn without axes or coordinates. Commonly used on dashboards, sparklines typically visualize trends over time, such as to show profit over the past several years. Although other Microsoft reporting tools, such as Excel and Reporting Services include sparkline elements, Power BI doesn’t have one. That is until now.
I contributed a “classic” sparkline custom visual to the Power BI Visuals Gallery. Once you import and add the sparkline to a report, you bind the sparkline to data using the Data tab of the Visualization pane. For example, you can aggregate a Freight field added the Value area over the CalendarQuarterDesc field added to the Category area. The resulting graph will sho how freight fluctuates over time. You can use any field to group the data, not just a field from the Date table.
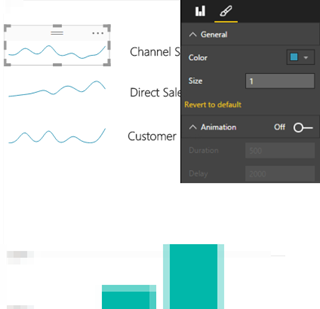
The sparkline supports several formatting options. The General section lets you change the line color and width. The default properties are “steelblue” as a color and one pixel for the line width. The Animation section lets you turn on an animation effect that draws the line gradually from left to right (who says that Power BI visuals have be to static?) Although in general I advise against animations and other visual distractors in real-life reports, I wanted to emphasize the point that Power BI visuals can support anything clients-side JavaScript can do. The Duration setting controls how fast the line draws (the default setting is 1,000 milliseconds) and the Delay settings controls the interval between redraws (the default is 3,000 milliseconds). The sparkline supports also a tooltip. When you hover anywhere on the viewport, a tooltip pops up that shows the name of the field added to the Value area and the data point values.
The main limitation of the current implementation is that similar to the Power BI gauge visualization, it doesn’t render over multiple lines, such as for each product category on rows. Preferably, at some point Power BI would support a repeater control similar to the SSRS Tablix region. This would allow nesting the sparkline into other visualizations, such as a table, that will repeat the sparkline for each row. As Power BI stands now, the only way to implement this feature is to draw the visual for each value of the category field, which would require also drawing labels for the row categories. However, it doesn’t repeat on rows, the sparkline could be used to display multiple measures arranged either horizontally or vertically as the screenshot shows. Another limitation related to the previous I’ve just discussed is that it supports only a single field in the Category area and a single field in the Value area. In other words, the sparkline is limited to one measure and one group. Continuing on the list of limitations, the tooltip displays the same information irrespective where you hover on the sparkline viewport as opposed to showing just the value of the data point behind the cursor.
I hope you’ll find my sparkline useful not only for your real-life projects but also for learning how to implement custom visuals.


