Atlanta Microsoft BI Group Meeting on January 9th (Getting Started with Power BI Paginated Reports)

Atlanta BI fans, please join us for the next meeting on Monday, January 8th, at 6:30 PM ET. Eric Flamm will review paginated (SSRS) reports in Power BI. Your humble correspondent will help you catch up on Microsoft BI latest. For more details and sign up, visit our group page.

Presentation: Getting Started with Power BI Paginated Reports

Delivery: In-person

Date: January 9

Time: 18:30 – 20:30 ET

Level: Beginner

Food: TBD


Agenda:

18:15-18:30 Registration and networking

18:30-19:00 Organizer and sponsor time (events, Power BI latest, sponsor marketing)

19:00-20:15 Main presentation

20:15-20:30 Q&A


Venue

Improving Office

11675 Rainwater Dr

Suite #100

Alpharetta, GA 30009


Overview: Power BI Paginated Reports are the successor to SQL Server Reporting Services reports (although SSRS is still part of the SQL Server BI Stack). Using the same RDL (report definition language) as SSRS, Power BI Paginated Reports enable report developers to create “pixel-perfect” reports with complete control over item placement, pagination, row and column grouping and subtotals, etc. In this demo-centric session, we’ll use Power BI Report Builder on the desktop to design reports using datasets from local sources as well as Azure databases. We’ll look at parameterization and custom expressions and publish our report to the Power BI service. If time permits, we’ll take a look at building paginated reports in the online service, a capability Microsoft released last year.


Speaker: Eric is an independent Business Intelligence consultant, serving a range of clients including service and manufacturing enterprises, startups, and non-profit organizations. His practice includes SQL Server-based projects as well as Excel, Office Automation, and the occasional Microsoft Access project. Eric works with the Atlanta PASS Chapter as the webmaster and has volunteered with SQL Saturday Atlanta since the first event (SQL Saturday #13). Recently, he has presented to SQL Saturday Atlanta, SQL Saturday Chicago, Atlanta Code Camp, the Atlanta Power BI chapter, and the Kennesaw (GA) Amazon Web Services Meetup group.

PowerBILogo

Notes on Fabric F2 Performance: Report Load

What a better way to spend a lazy holiday afternoon than to do more Fabric performance testing? In my previous post, I shared my results from a single-threaded ETL load test to gauge the F2 ingest performance and F2 did pretty well (or at least outperformed Azure SQL DB). Will F2 hold as parallelism increases? Throughput testing is especially important for report loads because parallel tasks can run within a report, such as visuals executing DAX queries in parallel, and across reports, such as when concurrent report requests overlap.

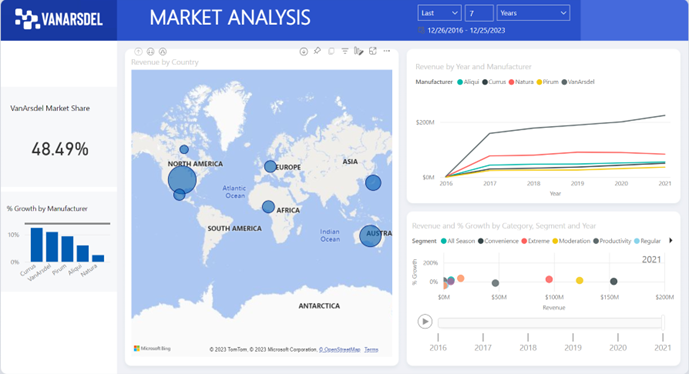
I used the artifacts are included in the “Microsoft Dashboard in a Day” for this test and load tested only the first report page.

The Sales fact table in the semantic model has over seven million rows so it represents a good size dataset. Naturally, the more involved the report is and the more data the semantic model has, the more CPU power and parallelism are needed. I used the Microsoft Power BI Dedicated Capacity Load Assessment Tool and configured it to filter the report on different years in order to avoid report caching. I ran four tests for 1, 2, 3 and 4 virtual users with no think time, and each test ran for 10 minutes.

Here are the results:

UsersTotal report rendersRenders per user
1631×63
21002×50
31353×45
41644×41

Here are some additional findings:

  1. Within the first minute or so, F2 generates reports fast, presumably because bursting comes into play to let F2 borrow and recruit more CPU resources. As the sustained load continues, Fabric starts scaling back and throttling CPU.
  2. As time goes by, report executions are getting increasingly slower. While during the first minute a report can take 1-2 seconds for example, later it might take as much as 40 seconds to render (users are unlikely to tolerate this). This happens even with one virtual user, presumably because the quarter of the core is insufficient.
  3. I haven’t encountered any errors. All report executions succeeded irrespective of how long they take.

What all these tests mean is that if Fabric is appealing to you, F2 can be a viable option for smaller organizations where report users are expected to run reports sporadically. In case of a sudden load, such as everyone running reports at 8 AM on Monday, Fabric bursting can elevate the pressure for the first minute or so. Of course, you need to weigh in many other factors, such as relenting control to Microsoft, waiting for the technology to mature, avoiding lock-in, evaluating budget (note that viewers would still need at least Power BI Pro individual licenses for capacities lower than F64), and various other considerations I covered in my previous Fabric-related posts.

Notes on Fabric F2 Performance: Warehouse ETL

As inspired by Amir Netz‘s encouragement to partners to test the Fabric F2 capacity performance, I got on a quest to test what it would do to ETL loads for Fabric Warehouse. I must admit that I was skeptical that a quarter of a core would take a warehouse off the ground, but as usual, life proved me wrong and “wrong” is a big understatement of what happened.

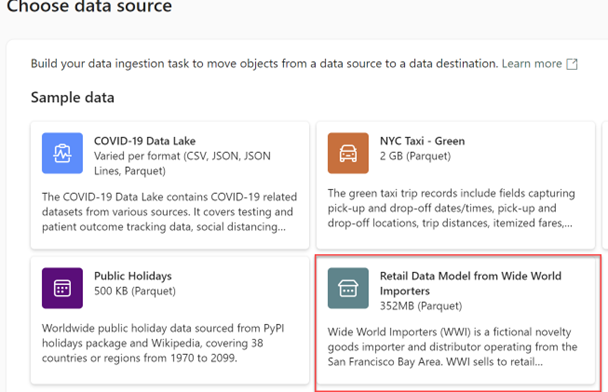
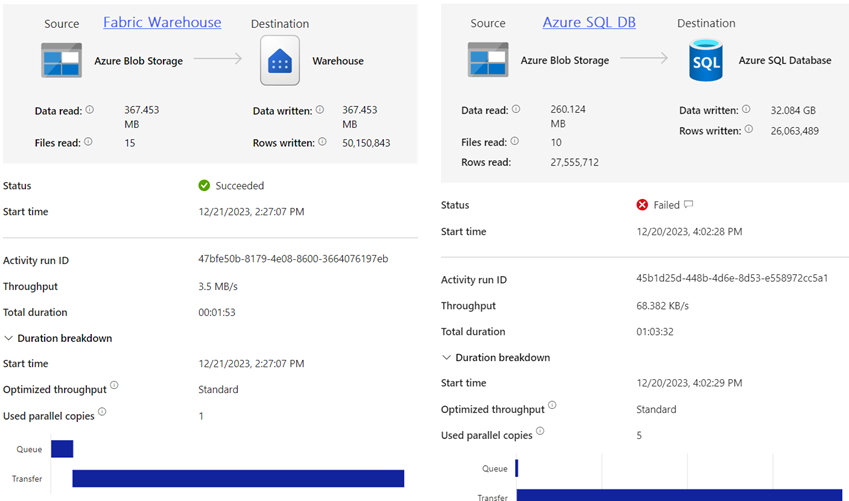
After provisioning a Fabric F2 capacity and a warehouse, I settled on the Retail Data Model for World Wide Importers sample star schema dataset consisting of five dimension tables and one fact table. In terms of performance, I was mostly interested in how long it would take for the ADF copy activity to insert all the data (50 million rows) in the fact table. Granted, it’s a limited test but enough to rule out the technology for real-life projects. Then, I compared the performance against Azure SQL Database Serverless running on up to 2 cores and provisioned by the free trial offer that Microsoft has on Azure. To exclude impact on data transfer between regions, both technologies were provisioned on East US 2 data region, which is the region where my Power BI tenant is hosted on.

Much to my surprise, it took less than two minutes to load all 50 million rows in F2, whereas it took 1 hour to load to load 27 million rows to Azure SQL Database before the maximum 30 GB disk space was exhausted! I couldn’t believe it so I ran the test three times to confirm. Surely, bursting helps a lot! Now, throughput would be a different story, but as far as the warehouse is concerned, it doesn’t matter because in most cases, data will be imported in a Power BI semantic model and the warehouse will be out of the picture. As a next step, I plan to test the report throughput to see what concurrent report load would saturate the F2 capacity.

In conclusion, the Fabric lowest capacity F2 ($262.80 monthly cost) could be a viable option for smaller organizations willing to make their foray in the Fabric world. On the downside, we must leave Fabric to marinate for a few months and add needed features, including surrogate keys and MERGE for Warehouse and on-prem connectivity for Azure Data Factory, in order to be in consideration for real-life projects. More tests are needed to gauge the F2 report throughput.

UPDATE 12/24/2023 I was curious how much loading the same dataset from a CSV file would impact performance. It took much longer: 18 minutes. The most significant factor was that loading from CVS requires staging to a data lake although this appears redundant because the CVS file was in a lakehouse in the same Power BI workspace. ADF spent a total of 18 minutes in the two-staged copy (ten minutes to stage the data and eight minutes to load the fact table from the staged copy). Therefore, Parquet outperformed significantly CVS, probably because the Microsoft-provided Parquet file was compressed.

A Case for Microsoft Fabric: Dynamics 365 Analytics

I might have identified at last a good case for Microsoft Fabric, but I’ll be in a better position to confirm after a POC with larger datasets. Dynamics Online, aka Dynamics 365, epitomizes the customer’s struggle to export their data hosted in SaaS cloud offerings for analytics or other purposes. Since unfortunately Microsoft doesn’t provide direct access to the Dynamics native storage (Azure SQL Database), which often could be the simplest and fastest solution, Dynamics has “compensated” throughout the years by introducing and sunsetting various options:

OptionProsCons
OData APIOriginal interfaceSlow, no query folding, currently deprecated
Data Export ServiceExport to Azure SQL DatabaseDeprecated
TDS endpointReal-time direct access to Dynamics Azure SQL DatabaseNot designed for massive extracts; slow
Dataverse APICurrently recommended by MicrosoftAs far as I can tell, no REST operations (see below); questionable performance
Dataverse connectorSame as Dataverse APISame as Dataverse API
Export to ADLSAutomatic synchronizationPerpetually in preview, files stored in proprietary CDM folder format
Fabric linkAutomatic synchronization; delta tables; SQL joinsRequires Fabric licensing; up to 60 min data sync delay; TBD

One of my clients, a large insurance company, has invested heavily in Dynamics 365. They have implemented various Power BI reports that would import millions of rows directly (without data staging) from common CRM entities, such as Account, Opportunity, as well as custom entities, using the OData API. The main struggle has always been that dataset refreshes take hours to complete. Because API calls don’t fold in Power Query, they apply REST operations to select a subset of columns, join tables, and filter data. They rely heavily on Power Query to shape the data which has worked reasonably well.

Dataverse Link to Fabric looks promising in addressing some of the above pitfalls. Once you set it up, it extracts Dynamics data as Delta tables in a Fabric lakehouse. From there, you can use the SQL endpoint to join and filter tables. After the initial synchronization, it might take up to 60 minutes to synchronize data changes in Dynamics so not really real-time data access but much better than the current state.

While working through the setup, keep the following in mind:

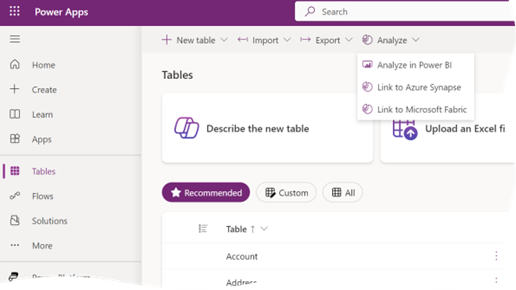
  1. The Link to Microsoft Fabric menu is found under the Analyze menu in the ribbon and not at the table level as the video shows. That’s because it exports all the tables.

  1. Referring to the comparison table between Fabric Link and Synapse Link, “No copy, no ETL direct integration with Microsoft Fabric” should be read “No ETL” because the data is still copied. Further, “Data stays in Dataverse” should read “Data is automatically copied to Fabric lakehouse”. Dataverse is just a wrapper on top of Azure SQL Database.
  2. As far as prerequisites, the most important one is “the workspace you choose to link with Dataverse must be assigned to a premium capacity in the same region as your Dataverse environment” with the emphasis on the “same region”. Not having them in the same region is a show stopper.

Again more testing is needed, but at this point I see the following advantages of using the Dataverse Link to Fabric:

  1. CRM data is staged in open file format (Delta Parquet tables) and available for any reporting needs without impacting Dynamics.
  2. No need to use APIs. Instead, you can use SQL to join and filter tables, such as to look up columns or filter data, which is much better than using the API syntax. This will also help you centralize column lookups in SQL views instead of doing this over and over for each report.
  3. Potentially much faster Power BI dataset refreshes
  4. No additional cost to Power BI Premium customers because the Fabric features are available in Power BI Premium.
  5. In a long term bypass importing data and providing users with almost real time (CRM data changes might take up to 60 minutes to synchronize) when the Microsoft DirectLake technology matures. I’m personally very interested in this option but I’ll wait until Power BI Desktop supports it.

Atlanta Microsoft BI Group Meeting on December 4th (Financial Modelling in Microsoft Fabric)

Atlanta BI fans, please join us for the next meeting on Monday, December 4th, at 6:30 PM ET. William Rodriguez will review the key Fabric components whilst walking through a full Financial deployment: data engineering with a tiered medallion architecture, data science with forecasting and other advanced analytics, and data analysis with Power BI. Your humble correspondent will help you catch up on Microsoft BI latest. For more details and sign up, visit our group page.

PLEASE NOTE A CHANGE TO OUR MEETING POLICY. WE HAVE DISCONTINUED ONLINE MEETINGS VIA TEAMS. THIS GROUP MEETS ONLY IN PERSON. WE WON’T RECORD MEETINGS ANYMORE. THEREFORE, AS DURING THE PRE-PANDEMIC TIMES, PLEASE RSVP AND ATTEND IN PERSON IF YOU ARE INTERESTED IN THIS MEETING.

Presentation: Financial Modelling in Microsoft Fabric

Delivery: In-person

Date: December 4

Time: 18:30 – 20:30 ET

Level: Intermediate

Food: TBD


Agenda:

18:15-18:30 Registration and networking

18:30-19:00 Organizer and sponsor time (events, Power BI latest, sponsor marketing)

19:00-20:15 Main presentation

20:15-20:30 Q&A


Venue

Improving Office

11675 Rainwater Dr

Suite #100

Alpharetta, GA 30009

Overview: Fabric is a powerful integrated BI platform. This presentation will review they key components whilst walking through a full Financial deployment: data engineering with a tiered medallion architecture, data science with forecasting and other advanced analytics, and data analysis with Power BI.

Speaker: William Rodriguez is the founder and lead consultant of Analytical Ants, an analytics company focused on procuring insights via data engineering, data science, and data analysis. William has led multi-million-dollar construction projects, acted as financial controller managing million-dollar monthly check productions, and built and deployed BI infrastructures at companies large and ‘small’ ($60M Revenue). Academically, he has his master’s in business, two undergraduate business degrees, four active Microsoft certifications, and over 70 accredited SQLBI training hours. William loves spending time with his amazing family and knows that he would be nowhere without Christ.

Sponsor: TBD

PowerBILogo

Atlanta Microsoft BI Group Meeting on November 6th (Exploring Bravo for Power BI)

Atlanta BI fans, please join us for the next meeting on Monday, November 6th, at 6:30 PM ET. Macro Russo will introduce us to the community tool Bravo for Power BI. Your humble correspondent will help you catch up on Microsoft BI latest. I’ll sponsor the event. For more details and sign up, visit our group page.

PLEASE NOTE A CHANGE TO OUR MEETING POLICY. WE HAVE DISCONTINUED ONLINE MEETINGS VIA TEAMS. THIS GROUP MEETS ONLY IN PERSON. WE WON’T RECORD MEETINGS ANYMORE. THEREFORE, AS DURING THE PRE-PANDEMIC TIMES, PLEASE RSVP AND ATTEND IN PERSON IF YOU ARE INTERESTED IN THIS MEETING.

Presentation: Exploring Bravo for Power BI

Delivery: In-person

Date: November 6

Time: 18:30 – 20:30 ET

Level: Beginner

Food: Pizza and drinks will be provided

Agenda:

18:15-18:30 Registration and networking

18:30-19:00 Organizer and sponsor time (events, Power BI latest, sponsor marketing)

19:00-20:15 Main presentation

20:15-20:30 Q&A

Venue

Improving Office

11675 Rainwater Dr

Suite #100

Alpharetta, GA 30009

Overview: Bravo for Power BI is a free external tool to analyze a model, format DAX, export data, and manage dates table and time intelligence calculations. We will explore this tool’s capabilities, with additional insights on the time intelligence calculations feature that can be customized by creating new templates. Some features are also available in more advanced tools like DAX Studio, but the goal in Bravo is to make them available to all Power BI users providing a simpler user interface that is good for the more common use cases.

Speaker: Marco Russo is a business intelligence consultant and mentor. He first started working on Analysis Services in 1998, back when Analysis Services was known as OLAP Services. Marco wrote several books about Power BI, Analysis Service, and Power Pivot with Alberto Ferrari. They also regularly write articles and white papers that are available on sqlbi.com.

Sponsor: Prologika

PowerBILogo

ADF Cross Environment Schema Compare Tool

Almost every BI project requires at least two environments, such as DEV and PROD. Unless I’ve missed something, one Azure Data Factory caveat irrespective of the code promotion path (manual or automated with Azure DevOps or Git CI/CD) is that it uses ARM template deployment where the template contains all the artifacts. The equivalent for database schema deployment would be to script the entire database schema which makes me nervous. Not to mention that ARM templates have their own gotchas, such as the one I discussed here when shared self-hosted integration runtimes are used.

So, I got on a quest to find an ADF schema comparison tool for a quick and dirty way to identify ADF code discrepancies between two environments and promote changes manually. Ideally, the tool would be something like SQL Server Database projects in Visual Studio.

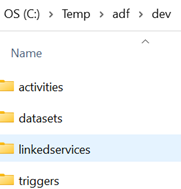
However, I wasn’t able to find such a schema comparison tool for ADF. The closest match was a PowerShell script by Riccardo Pericoto that extracts the ADF artifacts as files. My humble contribution was a few minor changes to the output folders, so that the artifacts from the ADF DEV service are saved in subfolders under a “dev” folder, while the production artifacts are saved under a “prod” folder. I’ve made this change to take advantage of a WinMerge feature that can scan subfolders. I’ve also added a line to delete all files in the target folders.

I enclose the script with the changes in bold:

# Install-Module -Name Az.DataFactory
# Credits: Riccardo Perico https://medium.com/riccardo-perico/comparing-azure-data-factories-exporting-all-the-components-929861ad2e00
Login-AzAccount
Get-AzSubscription -SubscriptionName 'MTX_Int_BI' | Set-AzContext -Name 'MyContextName'
Set-AzContext -Context $(Get-AzContext -Name "MyContextName")
$base_output_url = "C:\temp\adf\"
$pipeline_output = "activities"
$dataset_output = "datasets"
$linked_services_output = "linkedservices"
$triggers_output =  "triggers"

$adfv2_rsg_name_tc1 = 'mtx-rsg-adf-dev'
$adfv2_rsg_name_tc2 = 'mtx-rsg-adf-prod'
$adfv2_name_tc1 = 'mtx-adf-dev'
$adfv2_name_tc2 = 'mtx-adf-prod'

#Delete all files
Get-ChildItem -Path $base_output_url -Include *.* -File -Recurse | foreach { $_.Delete()}
$js = (Get-AzDataFactoryV2Pipeline -ResourceGroupName $adfv2_rsg_name_tc1 -DataFactoryName $adfv2_name_tc1) | Select-Object "Name"
$js2 = (Get-AzDataFactoryV2Pipeline -ResourceGroupName $adfv2_rsg_name_tc2 -DataFactoryName $adfv2_name_tc2) | Select-Object "Name"
$js_dst = (Get-AzDataFactoryV2Dataset -ResourceGroupName $adfv2_rsg_name_tc1 -DataFactoryName $adfv2_name_tc1) | Select-Object "Name"
$js_dst2 = (Get-AzDataFactoryV2Dataset -ResourceGroupName $adfv2_rsg_name_tc2 -DataFactoryName $adfv2_name_tc2) | Select-Object "Name"
$js_lks = (Get-AzDataFactoryV2LinkedService -ResourceGroupName $adfv2_rsg_name_tc1 -DataFactoryName $adfv2_name_tc1) | Select-Object "Name"
$js_lks2 = (Get-AzDataFactoryV2LinkedService -ResourceGroupName $adfv2_rsg_name_tc2 -DataFactoryName $adfv2_name_tc2) | Select-Object "Name"
$js_trg = (Get-AzDataFactoryV2Trigger -ResourceGroupName $adfv2_rsg_name_tc1 -DataFactoryName $adfv2_name_tc1) | Select-Object "Name"
$js_trg2 = (Get-AzDataFactoryV2Trigger -ResourceGroupName $adfv2_rsg_name_tc2 -DataFactoryName $adfv2_name_tc2) | Select-Object "Name"

foreach ($pl in $js)
{
    (Get-AzDataFactoryV2Pipeline -ResourceGroupName $adfv2_rsg_name_tc1 -DataFactoryName $adfv2_name_tc1 -Name $pl.Name).Activities | Sort-Object "Name" | Out-File $base_output_url"dev\"$pipeline_output"\$($pl.Name).txt"
}
foreach ($pl2 in $js2)
{
    (Get-AzDataFactoryV2Pipeline -ResourceGroupName $adfv2_rsg_name_tc2 -DataFactoryName $adfv2_name_tc2 -Name $pl2.Name).Activities | Sort-Object "Name" | Out-File $base_output_url"prod\"$pipeline_output"\$($pl2.Name).txt"
}
foreach ($d in $js_dst)
{
    (Get-AzDataFactoryV2Dataset -ResourceGroupName $adfv2_rsg_name_tc1 -DataFactoryName $adfv2_name_tc1 -Name $d.Name).Properties | Sort-Object "Name" | Out-File $base_output_url"dev\"$dataset_output"\$($d.Name).txt"
}
foreach ($d2 in $js_dst2)
{
    (Get-AzDataFactoryV2Dataset -ResourceGroupName $adfv2_rsg_name_tc2 -DataFactoryName $adfv2_name_tc2 -Name $d2.Name).Properties | Sort-Object "Name" | Out-File $base_output_url"prod\"$dataset_output"\$($d2.Name).txt"
}
foreach ($l in $js_lks)
{
    (Get-AzDataFactoryV2LinkedService -ResourceGroupName $adfv2_rsg_name_tc1 -DataFactoryName $adfv2_name_tc1 -Name $l.Name).Properties | Sort-Object "Name" | Out-File $base_output_url"dev\"$linked_services_output"\$($l.Name).txt"
}
foreach ($l2 in $js_lks2)
{
    (Get-AzDataFactoryV2LinkedService -ResourceGroupName $adfv2_rsg_name_tc2 -DataFactoryName $adfv2_name_tc2 -Name $l2.Name).Properties | Sort-Object "Name" | Out-File $base_output_url"prod\"$linked_services_output"\$($l2.Name).txt"
}
foreach ($t in $js_trg)
{
    (Get-AzDataFactoryV2Trigger -ResourceGroupName $adfv2_rsg_name_tc1 -DataFactoryName $adfv2_name_tc1 -Name $t.Name).Properties | Sort-Object "Name" | Out-File $base_output_url"dev\$triggers_output$($t.Name).txt"
}
foreach ($t2 in $js_trg2)
{
    (Get-AzDataFactoryV2Trigger -ResourceGroupName $adfv2_rsg_name_tc2 -DataFactoryName $adfv2_name_tc2 -Name $t2.Name).Properties | Sort-Object "Name" | Out-File $base_output_url"prod\$triggers_output$($t2.Name).txt"
}

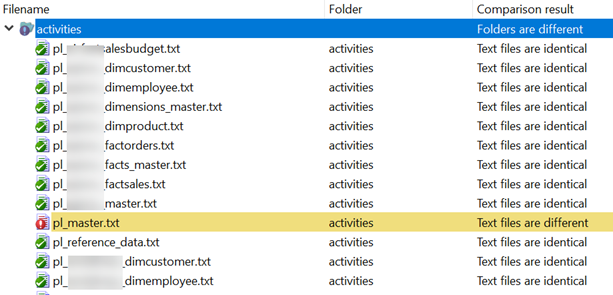
Once the files are saved, the next step is to use WinMerge configured to scan subfolders to identify differences:

Then, you can manually copy the JSON payload of the changed artifact and replace its equivalent in the other environment. Long live ADF continuous integration and delivery!

Deactivating ADF Activities

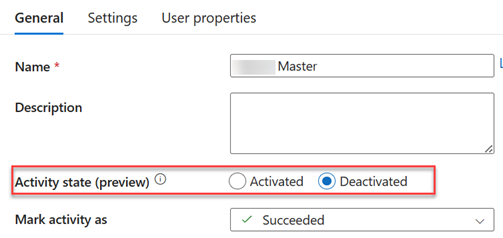
Lo and behold, Azure Data Factory now supports deactivating activities as a preview feature. It took only seven years…

You can deactivate/activate activity by right-clicking it in the canvas or from its General settings. You can also configure how the subsequent activities should treat a deactivated activity, with Succeeded being the most common outcome.

When All You Have is a Hammer… (Dbt Tool for ETL)

Someone asked the other day for my opinion about the open-source dbt tool for ETL. I hadn’t heard about it. Next thing I’ve noticed was that Fabric Warehouse added support for it, so I got inspired to take a first look. Seems like an ELT-oriented tool. Good, I’m a big fan of the ELT pattern whose virtues I extolled many times here. But a Python-based tool that requires writing templates in a dev environment, such as Visual Studio Code? Yuck!

So, what’s my first impression? Same thoughts as when I see developers use another generic programming language, such as C#, for ETL. You can do it but why?

For years, I’ve been trying to get developers out of custom coding for ETL to low-code ETL specialized tools, such as SSIS and ADF.

Just because you studied Python in college, should you use Python for everything? I guess the open-source custom code gravitational pull is too strong. Or there are plenty of masochists out there. One of their case studies hailed dbt for democratizing ETL because everyone knows SQL and can contribute. That’s true but what goes around SQL is also important, as well productivity and maintainability of the overall solution.

On the Azure platform my preferred ETL architecture remains ADF and ELT with SQL in stored procedures. I don’t see any dbt advantages. Dbt might make sense to you if want to stay vendor-neutral, but I’d argue that if you follow the ELT pattern, migrating your ETL processes to another vendor would be trivial.

What am I missing?

UPDATE 10/19/2023

I’m humbled by the interest and comments this blog inspired on LinkedIn. It might well become one of the most popular posts I’ve ever written! This is what I’ve established based on the feedback from people who have used dbt:

  1. Although designed for ELT, it does only the “T” (transformation) part of the ELT process. You’d still need other tools, such as ADF, to extract and load the data. And so in a typical DW project, you could use ADF to extract data from the data sources, stage it, and then execute your dbt process to load the DW tables.
  2. It’s a template-based tool, where you use Python-like syntax to define “models”, such a model corresponding to a fact table, and the SQL statement to load it. Therefore, the SQL statement is embedded inside the template.
  3. It supports features, such as tests, macros, lineage, and documentation.

I wonder how many ETL projects would need these features though. If yours does, then dbt might be of interest. For me, the tool is still a hard pass that shares the same dark corner as ETL automation tools and ETL with custom code. Everybody is trying to do more with less nowadays, so maintainability and productivity are more important. If you have resources and time, my recommendation would be to invest into a home-grown SQL generator that would auto-generate the “T” part, such as the MERGE statement.

Atlanta Microsoft BI Group Meeting on October 2nd (30 Power BI Tips and Tricks)

Atlanta BI fans, please join us for the next meeting on Monday, October 2nd, at 6:30 PM ET.  Michael Hewitt will share 30 tips to make you more productive with everything Power BI. Your humble correspondent will help you catch up on Microsoft BI latest. For more details and sign up, visit our group page.

PLEASE NOTE A CHANGE TO OUR MEETING POLICY. WE HAVE DISCONTINUED ONLINE MEETINGS VIA TEAMS. THIS GROUP MEETS ONLY IN PERSON. WE WON’T RECORD MEETINGS ANYMORE. THEREFORE, AS DURING THE PRE-PANDEMIC TIMES, PLEASE RSVP AND ATTEND IN PERSON IF YOU ARE INTERESTED IN THIS MEETING.

Presentation: 30 Power BI Tips and Tricks

Delivery: In-person

Date: October 2nd

Time: 18:30 – 20:30 ET

Level: Beginner to Intermediate

Food: Sponsor wanted

Agenda:

18:15-18:30 Registration and networking

18:30-19:00 Organizer and sponsor time (events, Power BI latest, sponsor marketing)

19:00-20:15 Main presentation

20:15-20:30 Q&A

Venue

Improving Office

11675 Rainwater Dr

Suite #100

Alpharetta, GA 30009

Overview: This session offers 30 tips and tricks born from years of working with Power BI in the trenches and teaching Power BI to others. We’ll cover many facets of Power BI including DAX, Power Query, visualization, external tools, and more! These tips aim to be practical and useful to Power BI users of all skill levels so that you can take them back to work and level up your Power BI solutions.

Speaker: Michael Hewitt leads the BI and Analytics team at Hunt Brothers Pizza, based in Nashville, TN. He enjoys data visualization and working with business users to help them leverage data more effectively in their daily jobs. In previous roles, Michael has delivered Microsoft based BI solutions in the healthcare, distribution, and manufacturing industries. He has also had the privilege of developing and delivering custom Power BI training for the Department of Defense. Outside of work, Michael is a husband, father of 3 children, is a leader in his local church, co-organizes the Nashville Modern Excel and Power BI user group, and enjoys drumming, woodworking, and hiking.


Speaker: TBD

PowerBILogo