Prologika Newsletter Spring 2024

One of the main goals and benefits of a semantic model is to centralize important business metrics and KPIs, such as Revenue, Profit, Cost, and Margin. In Power BI, we accomplish this by crafting and reusing DAX measures. Usually, implementing most of these metrics is straightforward. However, some might take significant effort and struggle, such as metrics that work at aggregate level. In an attempt to simplify such scenarios, the February 2024 release of Power BI Desktop includes a preview of visual calculations that I’ll review in this newsletter.

What’s a Visual Calculation?

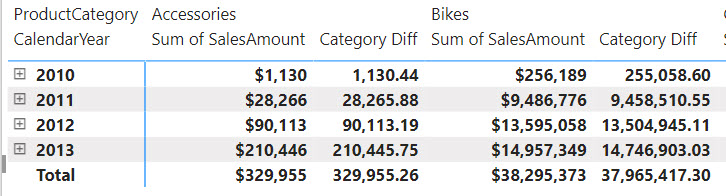
As its name suggests, a visual calculation is a visual-scoped DAX measure that works at the aggregate (visual) level. Don’t confuse the term “calculation” here with calculated columns, tables, or groups. Replace “calculation” with “measure” and you will be fine. Consider the following matrix:

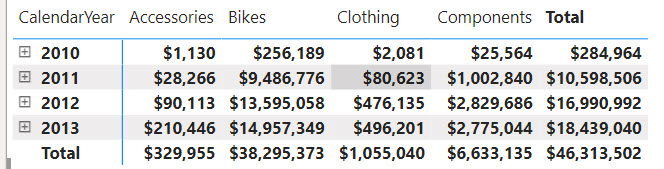
Suppose you need a measure that calculates the difference between the product categories in the order they are sorted in the visual. Implementing this as a regular DAX measure is a challenge. Yet, if we had a way to work with the cells in the visual, we can easily find a way to get this to work. Ideally, this would work similar in Excel, but DAX doesn’t know about relative cell references. However, visual calculations kind of do.

Let’s right-click on the visual and select “New calculation”. Alternatively, click the visual and then click the “New calculation” ribbon button in the Home ribbon. In the visual-level DAX formula bar, enter the following formula:

Category Diff = [Sum of SalesAmount] - PREVIOUS([Sum of SalesAmount], COLUMNS)

The Category Diff measure computes the difference between the current “cell” and the cell for the previous category. For example, for Bikes it will be $9,486,776-$28,266 (Accessories value).

The Good

As you can see, visual calculations can simplify aggregate-level metrics. Notice the use of the PREVIOUS function which is one the new DAX functions specifically designed for visual calculations. Notice also that the PREVIOUS function has additional arguments and one of them is the AXIS argument which specifies if the function should evaluate cells positionally on columns or rows. Traditional DAX functions don’t support the AXIS arguments because they are generic and not designed to operate on a visual level.

Finally, notice that visual-level formulas can only reference fields or measures placed in the visual. This is important as you’ll see later.

The Bad

Among the various limitations, the following will cause some pain and suffering:
1. You can’t export the data of a visual that has a visual calculation.
2. Drillthrough is disabled.
3. Can format visual calculations unless the visual supports it (the matrix visual does support measure formatting).
4. Can’t apply conditional formatting.
5. Can’t change sort order.
6. Can’t use field parameters.

The Ugly

The way Microsoft advertises this feature is that it is “easier than regular DAX” and performs better. My concern is that tempted by these promises, users will abuse visual calculations, such as for creating metrics that should be implemented as regular DAX measures so that any visual can benefit from them. And not before long, such users would find themselves into an Excel-like spreadmart hell which is what they tried to avoid by embracing Power BI.

I see a similar issue with DAX implicit measures, which Power BI users create by dragging a field and dropping it on a visual. I consider them a bad practice for a variety of reasons. Microsoft apparently doesn’t share the same concern (see their comments to my LinkedIn post on the same subject here). To their point, because visual calculations can only “see” fields placed in the visual, they naturally shield the user from abusing them. Let’s give it some time and see who’s right. Meanwhile, I wish this documentation article provides best practices and guidance on when to use implicit, explicit, and visual measures, including their limitations.

Visual calculations are incredibly useful but for limited scenarios. Therefore, please use these visual calculations only when regular DAX measures will not suffice. Business metrics should be centralized and should return consistent results, no matter the reporting tool or visual they are placed in. This is important for achieving the elusive single version of truth.


Teo Lachev
Prologika, LLC | Making Sense of Data
logo

Prologika Newsletter Winter 2023

I’ve covered my first impression about Microsoft Fabric in a series of blogs starting with this one. In the recap, I said that certain features might benefit organizations that are already on Power BI Premium because all Fabric features are available in Power BI Premium plans. However, as they stand, features such as Lakehouse Copy to Table (no automated synchronization), ADF pipelines (no connectivity to on-prem data sources), Data Warehouse (missing important T-SQL features), Direct Lake (only available online), are half-baked, thus barring wide-spread Fabric adoption. This newsletter covers a good case for Fabric that I’ve recommended for a large insurer that has invested heavily in Microsoft Dynamics 365 and Power BI Premium. I’ll be in a better position to confirm after a POC with larger datasets so follow my blog for future updates.

The Dynamics Integration Saga

Dynamics Online, aka Dynamics 365, epitomizes the customer’s struggle to export their data hosted in SaaS cloud offerings for analytics or other purposes. Since unfortunately Microsoft doesn’t provide direct access to the Dynamics native storage (Azure SQL Database), which often is the best solution, Dynamics has “compensated” throughout the years by provided the following options:

OptionProsCons
OData APIOriginal interfaceSlow, no query folding, currently deprecated
Data Export ServiceExport to Azure SQL DatabaseDeprecated
TDS endpointReal-time direct access to Dynamics Azure SQL DatabaseNot designed for massive extracts; slow
Dataverse APICurrently recommended by MicrosoftAs far as I can tell, no REST operations (see below); questionable performance
Dataverse connectorSame as Dataverse APISame as Dataverse API
Export to ADLSAutomatic synchronizationPerpetually in preview, files stored in proprietary CDM folder format
Fabric linkAutomatic synchronization; delta tables; SQL joinsRequires Fabric licensing; up to 60 min data sync delay; TBD

One of my clients, a large insurance company, has invested heavily in Dynamics 365. They have implemented various Power BI reports that would import millions of rows directly from common CRM entities, such as Account, Opportunity, as well as custom entities, using the OData API. The main struggle has always been that dataset refreshes take hours to complete. Because API calls don’t fold in Power Query, they apply REST operations to select a subset of columns, join tables, and filter data. They rely heavily on Power Query to shape the data which has worked reasonably well.

Dataverse Link to Fabric

Dataverse Link to Fabric looks promising in addressing some of the above pitfalls. Once you set it up, it extracts Dynamics data as Delta tables in a Fabric lakehouse. From there, you can use the SQL endpoint to join and filter tables.

After the initial synchronization, it might take up to 60 minutes to synchronize data changes in Dynamics so not really real-time data access but much better than the current state.

While working through the setup, keep the following in mind:

  1. The Link to Microsoft Fabric menu is found under the Analyze menu in the ribbon and not at the table level as the video shows. That’s because it exports all the tables.
  2. Referring to the comparison table between Fabric Link and Synapse Link, “No copy, no ETL direct integration with Microsoft Fabric” should be read as “No ETL” because the data is still copied. Further, “Data stays in Dataverse” should read as “Data is automatically copied to Fabric lakehouse”.
  3. As far as prerequisites, the most important one is “the workspace you choose to link with Dataverse must be assigned to a premium capacity in the same region as your Dataverse environment” with the emphasis on the “same region”. Not having them in the same region is a show stopper.

Cutting Cost

What if you are not on Power BI Premium and you are on a tight budget? Although I haven’t tested, this approach (suggested by Riccardo Perico) might work because Link to Fabric is available in all fabric capacities:

  1. Purchase a lower Fabric capacity, such as F2 or F4.
  2. Configure Dataverse Link to Fabric as usual.
  3. After the initial synchronization, pause and resume the capacity when not in use, such by using this approach.
  4. Import the data in a Power BI semantic model.

Dataverse Link to Fabric should queue the updates until the capacity is resumed.

Benefits

Again more testing is needed, but at this point I see the following advantages of using the Dataverse Link to Fabric:

  1. CRM data is staged in open file format (Delta Parquet tables) and available for any reporting needs without impacting Dynamics.
  2. No need to use APIs. Instead, you can use SQL to join and filter tables, such as to look up columns or filter data, which is much better than using the API syntax. This will also help you centralize column lookups in SQL views instead of doing this over and over for each report.
  3. Potentially much faster Power BI dataset refreshes
  4. No additional cost to Power BI Premium customers because the Fabric features are available in Power BI Premium.


Teo Lachev
Prologika, LLC | Making Sense of Data
logo

Prologika Newsletter Fall 2023


Microsoft Fabric is upon us with a grand fanfare. You can get a good overview of its vision and capabilities by watching the Microsoft Fabric Launch Digital Event (Day 1) and Microsoft Fabric Launch Digital Event (Day 2) recordings. Consultants and experts are extolling its virtues and busy fully aligning with Microsoft. There is a lot of stuff going on in Fabric and I’m planning to cover the technologies I work with and care about in more detail in future posts as Microsoft reveals more what’s under the kimono. This post is about my overall impression on Fabric, in an attempt to cut through the dopamine and adrenaline-infused marketing hype. As always, please feel free to disagree and provide constructive criticism.

The Good

Let’s just say that after 30 years working with Microsoft technologies, I’m very, very skeptical when I hear loaded terms, like “revolutionary”, “one-something”, “never has been done before”, etc. We all witnessed impressive launches for products that wouldn’t last a year. But it looks like this time Microsoft got their act together and put something that may pass the test of time and that I could recommend or use to help clients. As a starter, I’m glad that we’ve finally settled on a common and open storage (delta and Parquet) after years of experimenting with proprietary and open formats (CDM folders anyone?). This common storage has several advantages, including accessibility, portability, and virtualization.

I also like very much that Microsoft doesn’t enforce or propel a specific architecture or data flow pattern. If you want a lakehouse, sure you can have it. Care about medallion file organization? Sure, you can do that. Don’t want a lakehouse but data warehouse if you don’t deal with files and you don’t like a notebook with a blinking cursor? Not a problem. Want to skip staging data as files to the lake and load it directly in the warehouse? Fine. This is very different approach than other vendors take, such as to promote data warehousing on top of lakehouses and/or rule out relational databases whatsoever (read my thoughts on this here).

It’s obvious that a gigantic effort has taken place to unify and in same cases rewrite products, such as Analysis Services and Synapse Data Warehouse, to adhere to this new platform and vision. Basically, Fabric is the focal point of decades of hard work from all Microsoft teams involved in analytics to at least make a complicate data estate easy to access and manage.

The Bad

Going back to the presentation and my skepticism, I wish Microsoft could dialed down on some promises, like “one copy” of data. Anyone who has implemented a data warehouse of a decent complexity knows that data duplication is necessary. Data exists in the source systems, needs to be staged, and then transformed. Right there we have three copies. True, virtualization might help us avoid some data movement scenarios, such as accessing data directly in S3 buckets or importing in a Power BI dataset (for most companies a few extra minutes for refreshing datasets is not an issue).

Speaking of companies, it’s clear that Fabric (and presenters in the videos) targets the needs of large organizations with complex integration scenarios. But for most organizations “Big Data” is a few million rows and most common integration task is analyzing data from one or multiple ERPs. Should they care about Fabric? I guess it would really depend on its value proposition and budgets, but Fabric pricing hasn’t been announced yet. If Fabric is not available in PPU (Premium Per User), it probably would be dead on arrival for smaller organizations, as they can get modern analytics by spending less than $200/month on infrastructure excluding Power BI per-user licenses.

Finally, although presenters highlighted avoiding vendor lock-in as one of the major benefits of Fabric, you’re going to put all your eggs in one basket: Power BI/Fabric. Making Power BI a one-stop destination for analytics makes of course a lot of sense to Microsoft and increases its revenue potential (nothing wrong with revenue if it brings value). But for you Fabric would be a long-term commitment and you better make sure you avoid Microsoft-proprietary features as much as you can, such as Power Query dataflows and Azure Factory dataflows, should one day you decide to divest from Fabric, Power BI, or even Azure. Otherwise, you might find yourself in a similar situation as this client who had to migrate hundreds of Alteryx flows.

The Ugly

Confusion has descended upon the BI land after Microsoft throws and abandons products left and right. In fact, the Fabric documentation has sections to help you choose product, such as Lakehouse, New Synapse data warehouse, Power BI datamart (that one is easy, stay away from it especially if you plan to adopt Fabric). Should we add Synapse Dedicated Pools and Azure SQL Database to the comparison table?

Further, rewriting these engines means that we must go back to square one and wait for features. For example, the new Synapse data warehouse lacks so many T-SQL features and outside my plans for any near-term projects. Just when I thought Synapse SQL dedicated pools were caching up on T-SQL parity, someone moved my cheese… Well, good things happen to those who wait, so let’s give Fabric a year or so.


Other Fabric related posts:


Teo Lachev
Prologika, LLC | Making Sense of Data
logo

PROLOGIKA NEWSLETTER SUMMER 2023

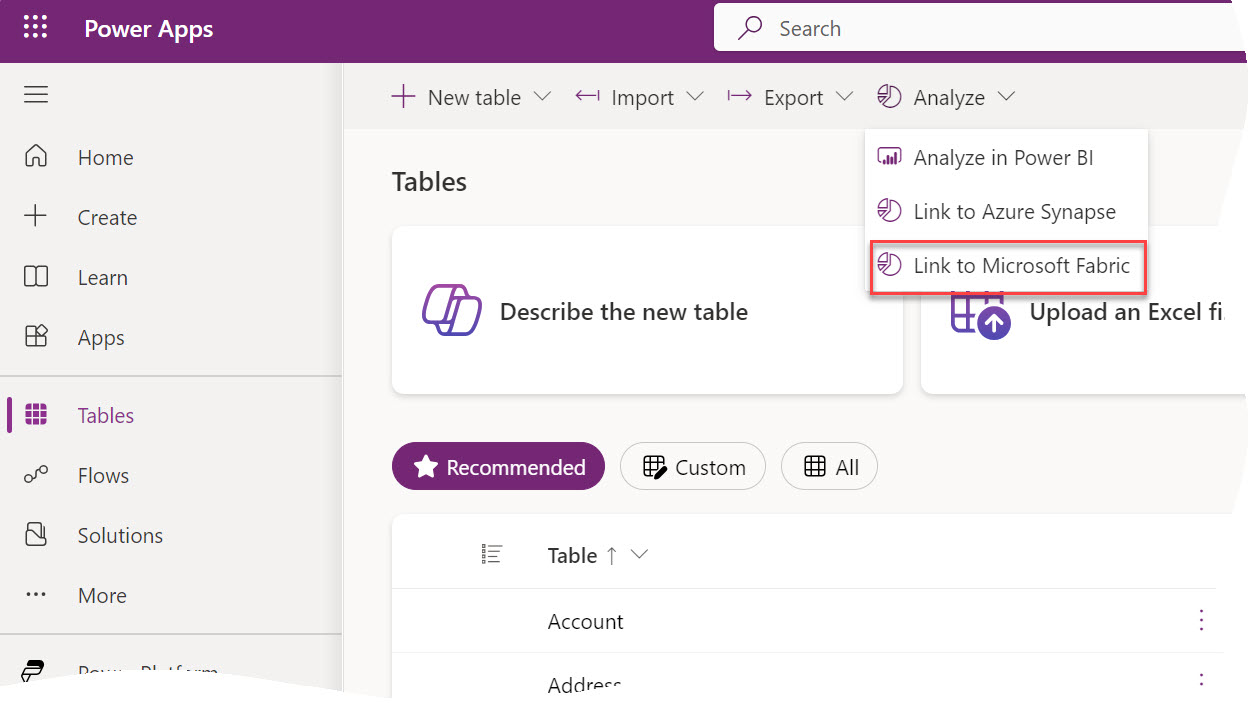
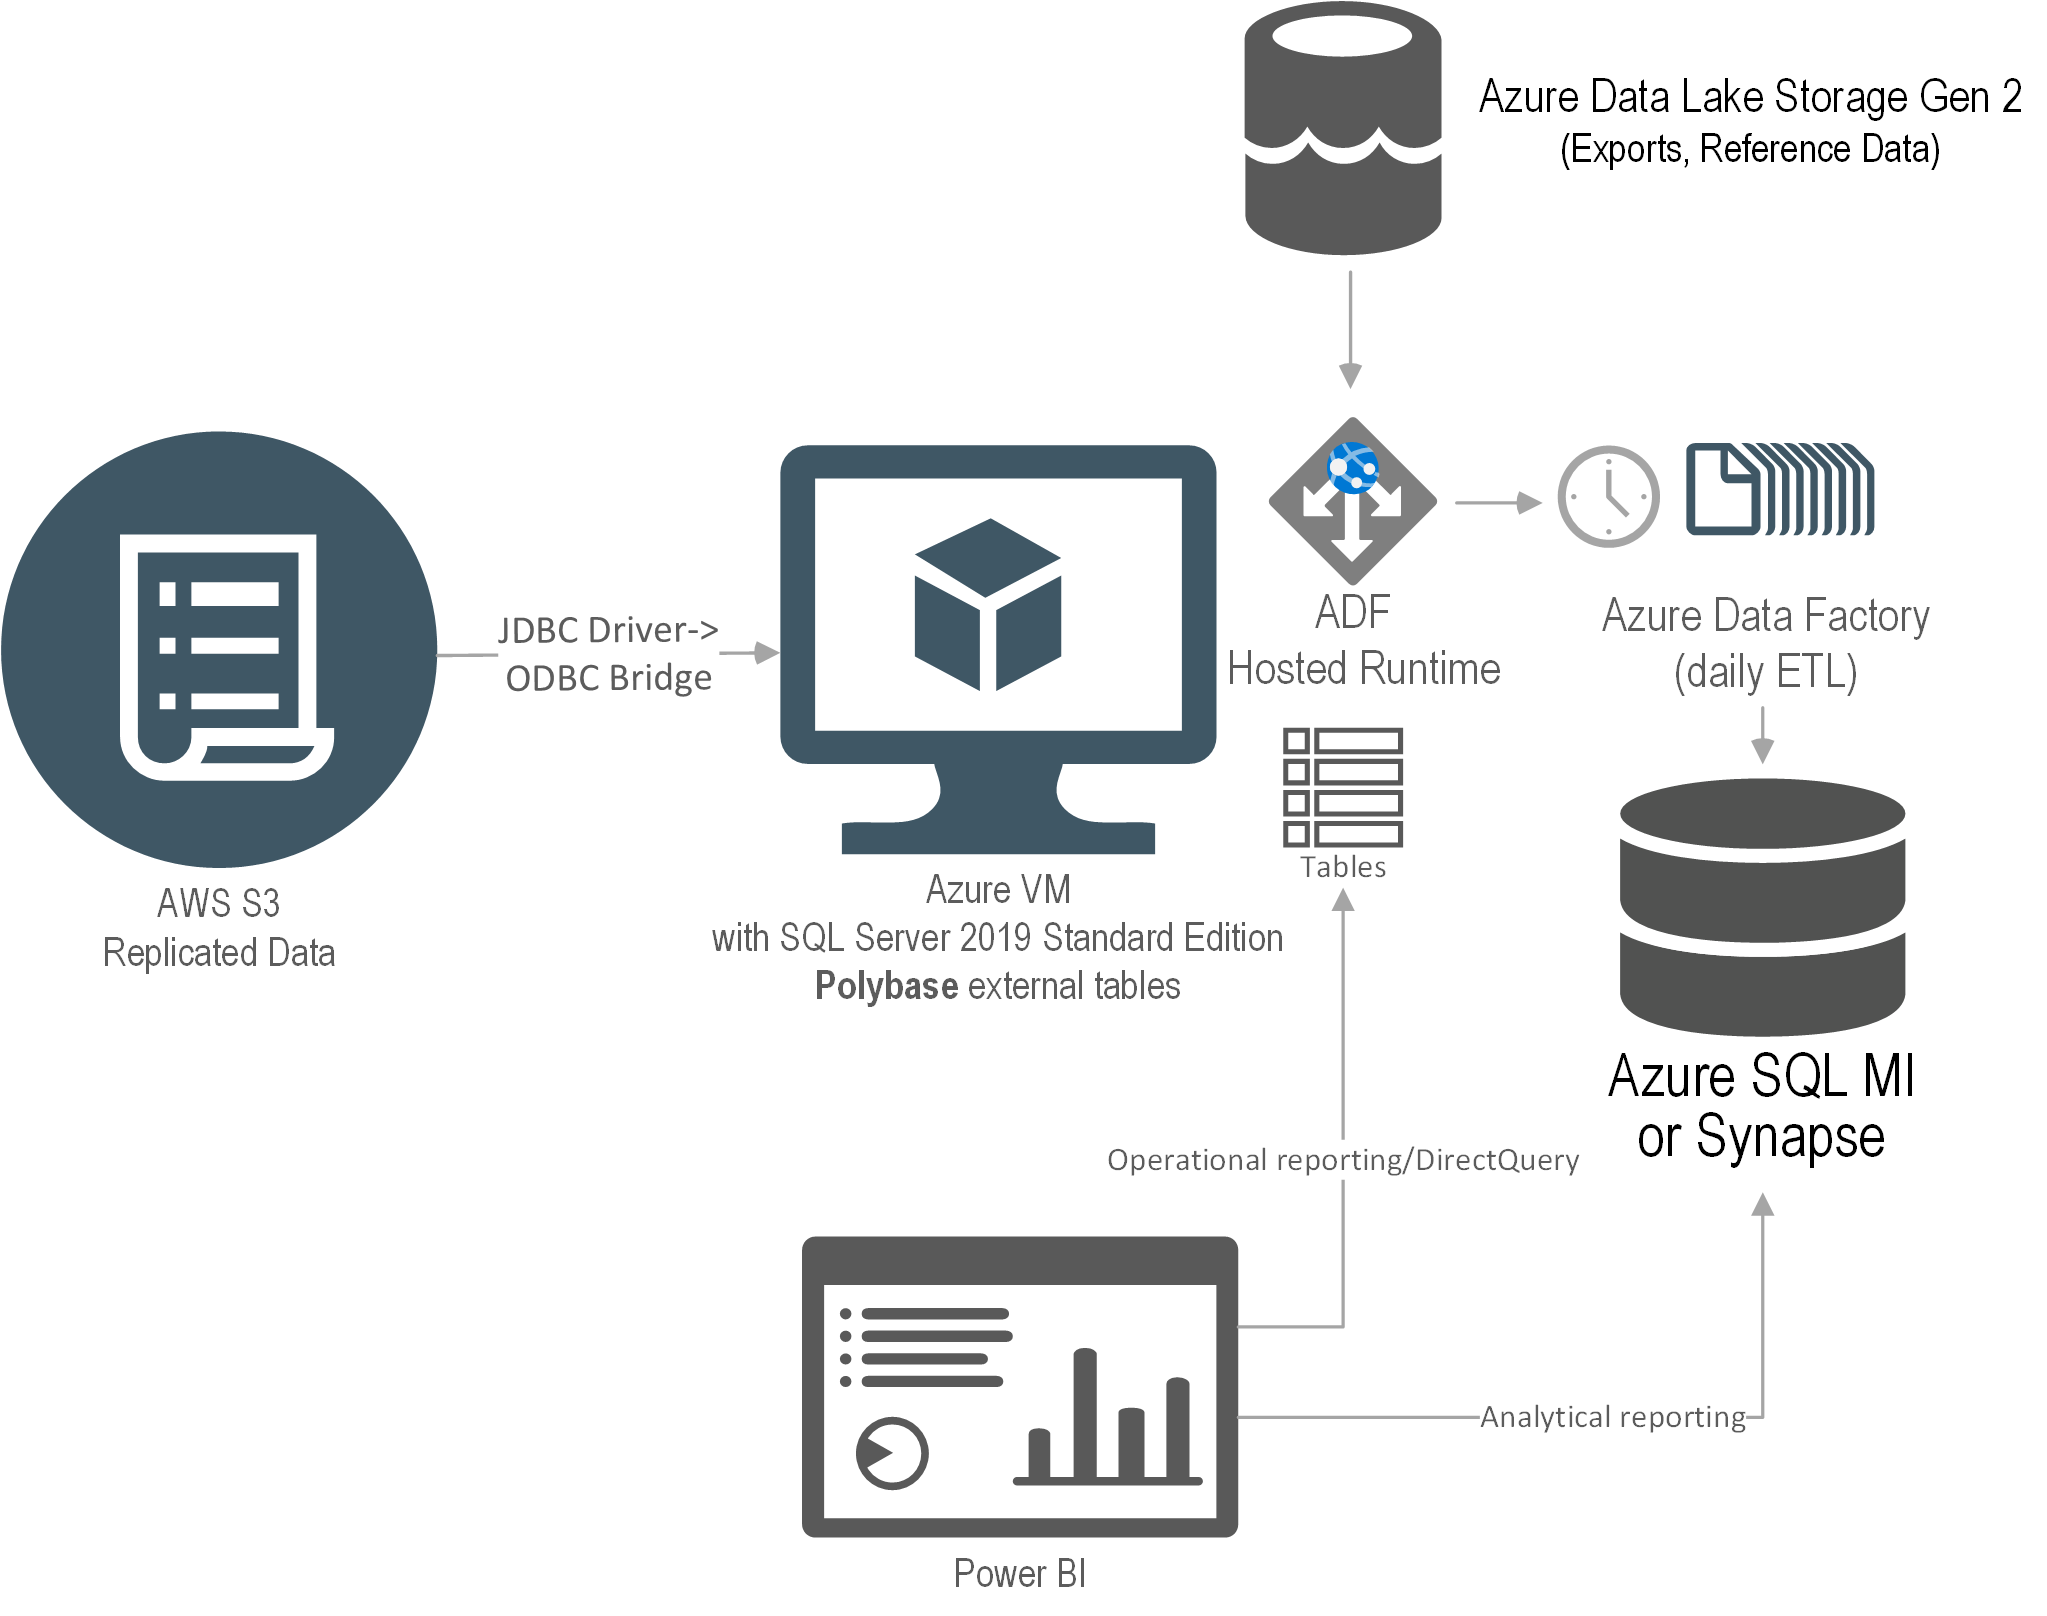
Enterprise Resource Planning (ERP) systems capture a wealth of information from main business processes within an organization, such as Sales, Inventory, Orders, etc. Therefore, a BI journey typically starts with analyzing the ERP data, with revenue analytics usually taking the center stage because of its vital metrics, such Revenue, Margin, Profit. In fact, this scenario has repeated so often for the past few years that Prologika has developed a fast-track implementation for ERP analytics. The client presented in this case study had more complicated integration needs, but other projects for both larger and smaller clients in the same or other industries have benefited from the same methodology.

Business Needs

The client manufactures and distributes electrical components. The company has grown rapidly through acquisitions, with every business unit having its own ERP system, including Dynamics and other business-specific ERPs. Some ERPs were installed on premises, such as Dynamics that stores data in a SQL Server database on the company’s data center, and others were cloud systems.

The client realized that it’s difficult to analyze performance across business units and disperse ERP systems. They envisioned a centralized and fully automated reporting solution that will consolidate data from all ERPs into a single repository so they can track sales across business units, sales people, vendors, and customers. In addition, they wanted their developers to enhance and maintain the solution, so simplicity and knowledge transfer were paramount.

Solution

After assessing the current state and objectives, Prologika recommended and implemented the following cloud architecture:

Prologika adopted an iterative approach to integrate the data from all five ERP systems where each ERP had its own iteration. Laying out the foundation, the first iteration was the most important and had the following main deliverables:

  1. Schema-first design – Prologika analyzed the requirements for Sales analytics and designed a star schema. The schema design was crucial because all other layers, such as ETL and semantic model, depend on it.
  2. Endpoints – Prologika worked with the ERP subject matter expert to implement endpoints that will provide a data feed for each table in the schema.
  3. ETL– Prologika used Azure Data Factory (ADF) no-code pipelines. The integration effort was dramatically reduced because all ERP endpoints would adhere to the same specification and hide the underlying details for each specific ERP, such as which tables would need to be joined. For best performance and fast knowledge transfer, Prologika followed the ELT pattern to transform and load the staged data using T-SQL stored procedures.
  4. Data warehouse – Prologika staged, transformed, and loaded the data into a centralized data warehouse repository whose structure was based on the star schema design in step 1.
  5. Semantic model – Prologika implemented a Power BI semantic model that delivered instantaneous insights and single-version of truth irrespective of the reporting tool used (Power BI, Excel, or third-party tools). The semantic model included the desired business metrics, such as time intelligence, variances, as well as data security.
  6. Reports – Power BI report “packs”, such as Sales Analytics, Order Analytics, were developed that connected to the semantic model. Users also could use Excel and other tools to create pivot reports without extracting and duplicating data.

Benefits

The solution delivered the following benefits to the client:

  • Fast data integration – Each subsequent ETL iteration could benefit from the common architecture.
  • Data consolidation – Data was consolidated into a single repository.
  • Low licensing cost – The solution had a licensing cost in the range of $400/month, with the most spent in Power BI licensing.
  • Easy maintenance – The client was able to quickly learn, maintain, and enhance the solution.


Teo Lachev
Prologika, LLC | Making Sense of Data
logo

Prologika Newsletter Spring 2023

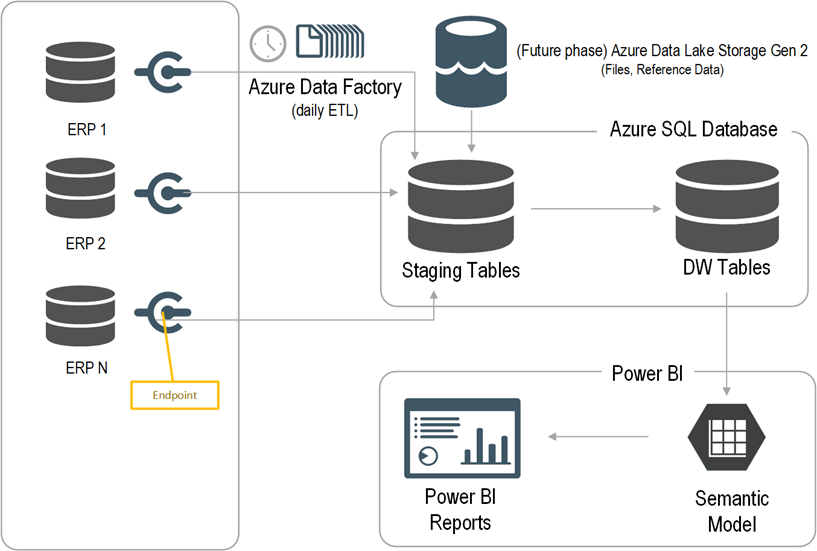
There has been a lot of noise surrounding a data lakehouse nowadays, so I felt the urge to chime in. In fact, the famous guy in cube, Patrick LeBlanc, gave a great presentation on this subject to our Atlanta Power BI Group and you can find the recording here (I have to admit we could have done better job with the recording quality, but we are still learning in the post-COVID era).

What’s Data Lakehouse

According to Databricks which are credited with this term, a data lakehouse is “a new, open data management architecture that combines the flexibility, cost-efficiency, and scale of data lakes with the data management and ACID transactions of data warehouses, enabling business intelligence (BI) and machine learning (ML) on all data.” It other words, it’s a hybrid between a relational data warehouse and a data lake. Sounds great, right? Visualizing this in Microsoft parlor, the last incarnation of the lakehouse architecture that I came across looks like this:

The Good

I’m sure that many large companies or companies with complex data integration needs could benefit from a similar architecture. As I said many times, staging data to a lake is a good thing when you must deal with files. For example, some cloud vendor that hasn’t matured enough to give direct access to your data, could decide to push files instead (I described a similar scenario in this blog). A “network share” on steroids, the data lake is the best place to store files. A good question here and the one I personally struggled with would be “what if the data comes from relational databases or from REST APIs?” Should you stage that data in a data lake as files before it flows into the data warehouse? A wise consultant’s answer here would be “it depends”. Here are some good reasons when this might make sense.

  1. Stage data first – For some, a large ISV company (see related newsletter here), had to integrate data from many databases with similar but not the same schema. They preferred to stage the data to a data lake and figure out the integration “mess” caused my schema discrepancies and data quality later.
  2. A glorified archive – For example, in case you want to reload the data, you can do it from the lake in the case where the source systems truncate data. However, my personal preference to address this scenario would be to stage the data into a relational Operational Data Store (ODS), especially in the case where changes must be tracked. In a nutshell, if I’m given a choice between a file or relational database, I’d go with the latter.
  3. Synapse – If you decide to host your data warehouse in a Synapse dedicated SQL pool and use Azure Data Factory (ADF) to load the data, ADF will stage the data to Azure Data Lake Service (ADLS) anyway to load it faster into Synapse. Another good thing for Synapse here is that you can use Synapse Serverless to query that data using SQL which might come handy (I share some “serverless” lessons learned here).
  4. Data science – There are some good reasons why data scientists prefer files instead of loading the data from a relational database. Or so I was told (I’m not a data scientist).
  5. Uniformity – If your organization prefers a uniform data flow path despite the additional effort, inconvenience, and redundancy, then this might make sense. Then despite the source data type (structured or unstructured), all data follows the same ingestion pipeline. Just make sure to hire more ETL developers.

Outside these considerations, when you can connect directly to the data source, staging data to files is probably overkill as files are notoriously difficult to deal with.

The Bad

Now let’s look at the so-called zones in the lake: raw, enriched and curated, sometimes also referenced as bronze, silver, and gold. The idea here is to enrich the staged data. So, the raw zone has the staged data 1:1 as in the source. Then let’s say a data scientist needs some enrichment, and we spin more ETL to add a bunch of columns to some file. And then Business needs to reference the data that might require more enrichment. So, into the ETL rabbit hole we go again.

The problem is that many people take this architecture verbatum, whether it makes sense or not. A question came from the audience during Patrick’s presentation “What data do we add to these zones?” How do we know when it’s time to move to the next zone? And the answer here is that these zones are just a recommendation that someone has come up with. A large organization might benefit from them. But in most cases in my opinion spinning more and more ETL and moving data around just so that you follow some vendor’s best practices, makes no sense. And should you stage the data 1:1 from the source? In some cases, like the Get Data First aforementioned scenario, it might make sense. But in most cases, it would be much more efficient to stage the data in the shape you need it, which may necessitate joining multiple tables at the source (by the way, a relational server is the best place to handle joins).

The omni-presence of Synapse in such architectural diagrams is questionable at least. As I stated in another newsletter, like a red giant star, Synapse seems to engulf everything in its path in order to increase its value potential. But Synapse shouldn’t be a default choice for most organizations. It’s rather expensive and has limitations, such as lacking important T-SQL features.

Finally, Spark/Databricks that orchestrates the data preparation with Python or some other custom code since all the toolset you get is a notebook with a blinking cursor. What happened to low code, no code approach? More ETL developers to the rescue…

The Ugly

The omnipresence of the delta lake regardless if it makes sense or not. I’m sure that some scenarios for staging changing data into a lake, such as IoT streaming, will benefit greatly from a delta lake. But it shouldn’t be a default recommendation. The moment we introduce a delta lake, our tool choice becomes rather restricted because of the file format. On ETL side of things, for example, you must use data flows with Azure Data Factory (I’d personally favor ELT over data flows). And to read the data, you must provision either a Spark cluster or Synapse Serverless. So, complexity increases together with cost while data accessibility decreases.

UPDATE 05/28/2023 Microsoft Fabric embraced the delta format as the its native storage but provides more options, including Power Query dataflows and Azure Data Factory copy activity, to load data. All Fabric services save and read data from the delta lake and you don’t have to provision anything.

And if you go with Databricks (credited for inventing the delta lake too), they are far more ambitious . They want to replace RDBMs for OLAP (OLTP won’t work with a delta lake for performance reasons). We’ve seen similar claims before and how they ended. Another question came from the audience during the presentation was if a lakehouse can deliver the same performance as a relational database. One house must be redundant, right? True, after rewriting their software, Databricks can deliver some decent performance (they even claim to be the world’s fastest “data warehouse” although only one other vendor submitted results to that specific benchmark). James Serra (Data & AI Solution Architect at Microsoft), whose excellent blog discusses these topics in detail, recently gave our group a presentation and said that anyone he knows of that has tried replacing a relational data warehouse with a data lake, has failed. Enough said.

What’s a best practice? A best practice to me is adopting the most efficient way to achieve something without sacrificing too much flexibility for what might be thrown at you in the future. To me, a lakehouse as a replacement for a relational data warehouse or as a default staging area is as big of a hype as Big Data was, with all the vendor propaganda surrounding it to buy stuff you don’t need. Large organizations with complex integration needs might benefit from the lakehouse architecture shown above. However, most companies could save a lot of implementation, maintenance, and licensing costs by simplifying it and judicially introducing pieces when it makes sense.


Teo Lachev
Prologika, LLC | Making Sense of Data
logo

Prologika Newsletter Winter 2022

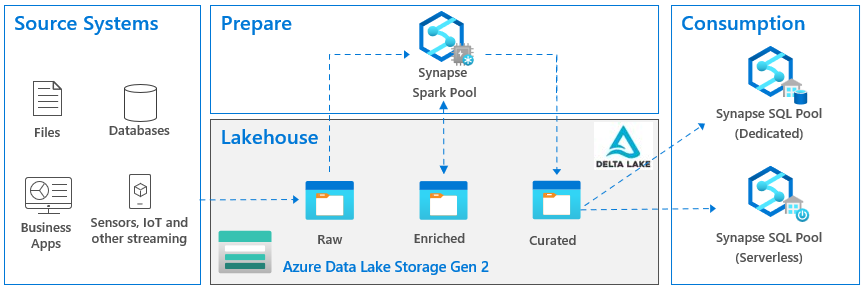
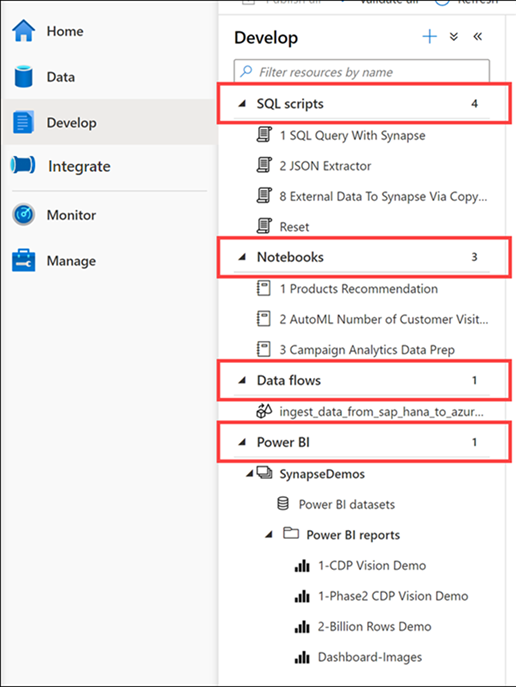
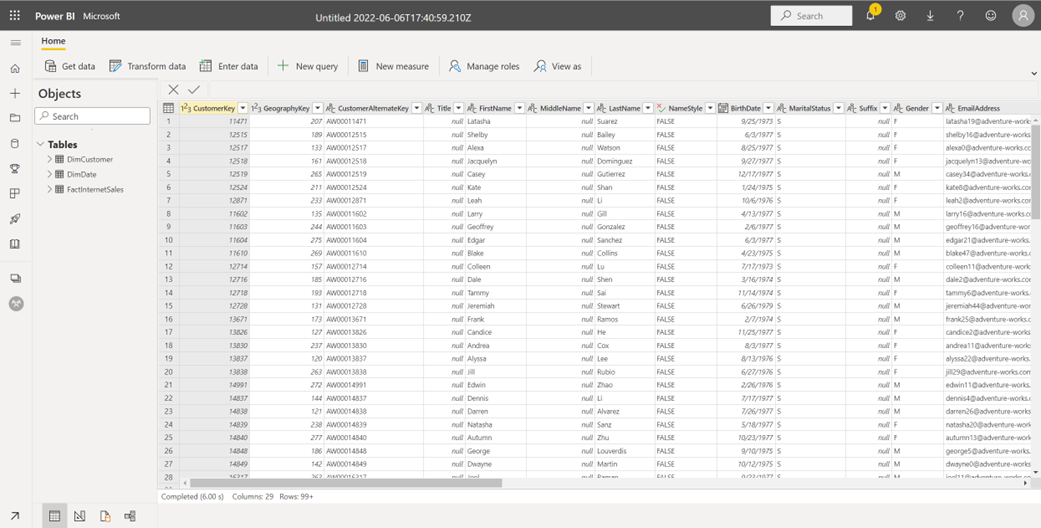
A few days ago an exalted customer shared that they’ve acquired Synapse and now they’re ready for Power BI modeling. He just wasn’t sure how to give business users access to Synapse so cool self-service BI can finally start. In the process of the conversation, it became clear that he opened Synapse Studio and was left with the impression that Synapse has semantic modeling features. This is what happens when Marketing gets involved and people get confused about what a tool actually does. This newsletter attempts to clear up this confusion.

What’s Synapse?

Think of Synapse (aka Azure Synapse Analytics) as a marketing name that spans multiple unrelated (or rather loosely) related services that are sold separately but are bundled together to fulfill a vision of a “unified analytical platform”. This vision is further emphasized by Synapse Studio – an online tool to work with and monitor the Synapse services.

Like a red giant star, Synapse seems to engulf everything in its path.

Let’s explain each service in the order it’s listed in the Azure pricing calculator. Again, each service has its own pricing model, and the “bundle” doesn’t give you any price break.

  • Data Integration – This is Azure Data Factory, which is typically acquired and installed as a standalone service. Why would you want to create ADF pipelines inside Synapse Studio instead of ADF Studio is beyond me. Another caveat to watch for regarding data integration is that Microsoft seemingly emphasizes the role of ADF data flows (at least there is a separate “Data flows” section in Synapse Studio) despite that the ELT pattern is a best practice to load data into the SQL dedicated pool.
  • Data Warehousing – Synapse comes with a preconfigured “serverless” pool that can be used to virtualize data stored in Azure Data Lake. This is a very useful service that allows you to query data in ADLS files using T-SQL. Check this case study to learn how Prologika used this feature in a real-life project. This tab also provides pricing for a dedicated SQL pool but since there is a separate tab for it, I’ll cover it further down.
  • Big Data Analytics – You can optionally provision an Azure Spark pool to process data or apply ML at scale using the Microsoft implementation of Apache Spark.
  • Log and Telemetry Analysis – A recently introduced type of pool for analyzing large volumes of data streaming (i.e. log and telemetry data) from applications, websites, or IoT devices using Kusto Query Language (KDL).
  • Dedicated SQL Pool – This is your SQL Server (or rather Azure SQL Database) on steroids for storing and querying massive data volumes that was previously known as Azure SQL DW. While you gain scalability, you lose various T-SQL features so don’t think that you can seamlessly migrate your on-prem SQL databases to Synapse. Also, for now, a dedicated pool is limited only to a single database.
  • Azure Synapse Link – Another recently introduced service to automatically synchronize data from Azure Cosmos DB and SQL Server 2022 (without using change data capture).

What Synapse is not?

Despite that Synapse Studio might trick you otherwise, Synapse is not:

  • Synapse is not a semantic modeling tool. Although you’ll see a Power BI section in the Develop tab of Synapse Studio, modeling is still done with Power BI Desktop (or other professional tools) and published to Power BI. As with ADF, why would a developer want to register your Power BI artifacts in Synapse Studio is another thing that escapes me.
  • Synapse is not a data integration tool, master data management tool, or data cataloging tool.
  • Synapse shouldn’t be your default option for data warehousing in the cloud. In my experience, Synapse would be an overkill for data processing needs of most companies because there are more cost-effective options for SQL Server in the cloud with less data.


Teo Lachev
Prologika, LLC | Making Sense of Data
logo

Prologika Newsletter Fall 2022

BI implementation shortcuts are tempting and disguise themselves as cost-effective. True, you can slap a Power BI dataset on top of your data (the cornerstone of self-service BI), but most BI implementations will greatly benefit from a datamart, irrespective of the propaganda of self-service BI vendors. I explain the benefits of datamarts vs Power BI datasets directly on data sources in my blog “Datasets vs. Datamarts”. This newsletter discusses a newly released Power BI feature that attempts to simplify the implementation of datamarts by business users.


Understanding Datamarts

Let’s define a datamart as a centralized repository for hosting clean and trusted data that is typically organized in a star schema, i.e. as a set of fact tables and dimension (lookup) tables. BI pros would typically host a datamart in a relational database. Nowadays, a cloud-based datamart, such as a datamart hosted in Azure SQL Database, Azure SQL Managed Instance, or Azure Synapse, is the norm. Once the datamart schema is designed, a BI pro would use a professional tool, such as Azure Data Factory (ADF) to load the datamart periodically, such as once every night.

As Microsoft announced here, Power BI datamarts are mean to democratize datamart implementations by business users. In my opinion, this is yet another premium feature, spearheaded with great vision and effort, but questionable practical value. In a nutshell, a Power BI datamart is a combo of Power BI Premium and a Microsoft-hosted Azure SQL Database aiming to simplify the implementation of a departmental datamart.

The Good

Unlike other vendors, such as Domo and their proprietary and overly expensive stack, Microsoft has decided to go with somewhat open solution consisting of tools that Power BI users already know: Power Query, Power BI Desktop (for the first time some of its modeling features, such as relationships and DAX measures, made it to the cloud), and SQL Server. Microsoft provisions the database for you although surrounds it with some red tape (more on this in a moment). Thus, a business users aiming for “no code, low code” experience will whip out Power Query dataflows that populate the database and then build a model (dataset) directly in Power BI Service. Obviously, the main goal is to simplify the experience as much as possible where all the action happens online.

It’s nice that Microsoft chose hosting the data in a SQL database instead of a “lakehouse”. Apparently, they learned some painful lessons from Power Query CDM folders. The database size is up to 100 GB which is not bad at all. I also like that some Power BI modeling features finally made it to Power BI Service, but unfortunately only in the confines of the datamart feature.

The screenshot below shows how a business user can use Power Query dataflow to transform and save the data into a Power BI datamart.

The Bad

From the announcement, “Best of all, IT doesn’t have to worry about getting all data into centrally governed data sources, thus providing discipline at the core and flexibility at the edge.” I failed to see how this will provide “discipline at the core” – a tenant that Microsoft learned from their own pain points after tilting too much toward self-service BI. I’ve also seen statements online that business users don’t have to “consult with IT anymore” when implementing datamarts. Really? What happened to managed self-service BI? I’m sure IT will be thrilled having corporate data in Microsoft-owned databases that they can’t manage and queries running amuck and consuming precious premium resources. Luckily, the admin portal has a switch to control who can create these datamarts. I hope at least we have a BYO (bring your own) database feature at some point.

The elastic Azure SQL database that Microsoft provisions is read-only, meaning that you can’t extend it. I’m a big fan of pushing calculations as much upstream as possible to SQL Server, such as by implementing SQL views, but we can’t do that. Instead, we would use Power Query (what else of course) for all data transforms. But I have serious reservations against Power Query dataflows – a tool that is known to cause performance issues without providing any troubleshooting and maintenance insights.

The Ugly

Do we really need this feature? I would argue that what was really needed was extending Power Query with “destinations” where the user can specify where the data would land. If that was implemented, IT could selectively let business users augment the infrastructure set up by IT with self-service ETL (more than likely temporary) that sinks the data into an IT-sanctioned database.

Further, it would have gotten us out of another proprietary mess that forces dataflows to save their output into CDM folders that make sense only to Microsoft (see my “Power BI Dataflows vs ADF Mapping Data Flows” blog for the gory details). Want to save dataflow data somewhere else? For now, you must use Power BI datamarts because this is the only way you can have your data in a (Microsoft-provided) relational database and nowhere else.

Conclusion

Recently, an enterprise client decided to migrate all self-service Alteryx flows to IT-governed ADF pipelines. More than likely, Power BI datamarts will be heading in that direction. Be very careful about any pure self-service features, as you might find yourself in a bigger mess that you tried to solve.


Teo Lachev
Prologika, LLC | Making Sense of Data
logo

Prologika Newsletter Summer 2022

The workhorse of any modern BI solution is the semantic model that provides unparallel performance and contains business logic and security roles. Microsoft BI gives us three options to host semantic model: SQL Server Analysis Services (SSAS), Azure Analysis Services (AAS), and Power BI.  This newsletter explains why it might be beneficial to consider AAS and includes a script for automating resuming, processing, and synchronizing a model hosted on AAS.

Why Azure Analysis Services?

Microsoft BI practitioners have three options for hosting semantic models: SSAS (on prem), Azure Analysis Services (cloud), and Power BI (cloud). AAS is somewhat caught between a rock and a hard place. Given that Power BI gets the most attention for cloud deployment, why would you consider AAS at all? There are two main reasons:

  1. Cost – Organizational semantic models might require a lot of memory and crunching power. Hosting them on AAS might be more cost effective. For example, AAS S4 runs at around $5,000 which at the same price point as Power BI Premium P1. However, it gives you 100 GB of RAM and 20 cores, whereas P1 has only 25 GB and 8 cores.
  2. Scaling out – A feature unique to AAS is ability to scale out to multiple query replicas. This is not an option with Power BI Premium, and it requires quite a bit of setup with SSAS. However, AAS makes scaling out easy by just changing a slider. And once you’re done, you can pause it, so it doesn’t incur cost!

Automating the solution

Scaling out proved to be a useful feature lately when a client wanted to process massive queries in parallel. We cloned the model to AAS and wrote an ETL job to parallelize the query execution.

Note that the number of replicas depends on the data region and pricing level. For example, only East US 2 and West US support up to 7 query replicas up to S4. Another thing to watch for is that it’s not enough to just process the model on a scale-out farm. You’d need also to synchronize it across the query replicas. This could be done manually in the Azure Portal or automated, such by using the PowerShell script below that you can plug in a SQL Agent job. The script uses a regular AAD account which has admin rights to the server. You can also use a service principal, but I opted for a regular account because Microsoft removed the option for no expiration date for the client secret (the maximum lifetime of a client secret now is two years).

Import-Module Az.AnalysisServices
$password = "<account password>" | ConvertTo-SecureString -asPlainText -Force
$username = "craas@<domain>.com"
$aasendpoint = "asazure://aspaaseastus2.asazure.windows.net/crliveaas1"
$aasendpointmgmt = "asazure://aspaaseastus2.asazure.windows.net/crliveaas1:rw"
$TenantId = "<tenant id>"
$credential = New-Object System.Management.Automation.PSCredential($username,$password)
$defaultProfile = Connect-AzAccount -Credential $credential -Tenant $TenantId

Set-AzContext -Tenant $TenantId -DefaultProfile $defaultProfile
$server = Get-AzAnalysisServicesServer -ResourceGroupName "crliveaas_rg" -Name "crliveaas1" -DefaultProfile $defaultProfile
if ($server.State -eq "Paused")
{
    Resume-AzAnalysisServicesServer -Name "crliveaas1" -ResourceGroupName "crliveaas_rg"  
    #process database; ClearValues removes the data to reduce the memory footprint
    Invoke-ProcessASDatabase -Server $aasendpointmgmt -DatabaseName "<databasename>" -RefreshType "ClearValues" -Credential $credential
    Invoke-ProcessASDatabase -Server $aasendpointmgmt -DatabaseName "<databasename>" -RefreshType "Full" -Credential $credential

    # sync database
    Add-AzAnalysisServicesAccount  -Credential:$credential -RolloutEnvironment:"aspaaseastus2.asazure.windows.net"
    Sync-AzAnalysisServicesInstance -Instance $aasendpointmgmt -Database "<databasename>" -PassThru
}

Conclusion

When it comes to cloud deployment of Analysis Services semantic models, Power BI is preferable because you’re always on the latest features. However, Azure Analysis Services can help you reduce cost and scale out query execution – feature that Power BI doesn’t support.


Teo Lachev
Prologika, LLC | Making Sense of Data
Microsoft Partner | Gold Data Analytics

logo

Prologika Newsletter Spring 2022

Nowadays, it’s unlikely to envision a data analytics solution without ingesting data from some cloud vendor. Unfortunately, as many of you have found out the hard way, moving to the cloud, such as moving your on-prem ERP system to the vendor’s cloud offering, comes at a huge burden – you relinquish control to the vendor and lose access to your data. In this letter, I’ll present several options for extracting your data out of the vendor’s realm.

I previously ranted here about cloud prohibitors – cloud providers that negate the benefits of moving to the cloud by enforcing all sorts of hoops to get to your data. This blog summarizes a few data integration options with cloud vendors that I’ve used in my projects, ranked from best to worst

Direct access to the database

This is by far your best option. If the provider allows you to access the data by directly connecting to its native storage, you should take it even if it involves higher fees, such as upgrading to a “premium” tier (a travesty considering that you didn’t have pay higher fees with their on-prem installations). There are no insurmountable engineering barriers for the vendor to provide direct access to the data in its native storage, but very few cloud vendors do it citing “issues”, such as security, impact on operational processes, etc. Here is a free piece of advice to cloud vendors: provide direct access to the underlying relational database and use this as a big differentiator against the competition. Security and performance should be on you and not the customer.

Data staging

If the direct access is not an option, the second best would be for the vendor to stage the data out, ideally to a relational database you provision, such as by using the Dynamics Data Export add-in to export data from Dynamics Online (now regretfully deprecated by Microsoft in favor of staging to data lake). Unfortunately, it looks like the norm nowadays is to export to a data lake as flat files and the extraction path becomes relational database -> flat files -> relational database. I hope that makes sense to you because it doesn’t to me. Things to watch out here for are where is the data lake located (Azure, AWS, others) and what integration options are provided. For example, only major ERP vendor supports only S3 as a data lake and provides and a JDBC driver to connect it (JDBC is a Java-based connector that can’t be used by any Microsoft-based integration tool.

Data push as flat files

Smaller and more flexible cloud providers might be willing to push the data to a storage that you provide. In such cases, you should strongly consider Azure data lake instead of FTP. For example, one cloud provider I integrated with used Ruby to call the Azure API to post data extracts to the client’s data lake storage that we set up.

REST APIs

Most cloud integration scenarios will fall in this bucket so that the vendor ensures “secure” and “controlled” access to data. The reality is that many of these REST APIs are horrible in both implementation and throughput. For example, the REST APIs of another ERP vendor couldn’t handle a batch export of 500,000 rows (a dataset that can fit into an Excel spreadsheet and be emailed around mind you). Their server would time out because of the “massive” data, and the client was asked to use callback APIs to chunk the export which of course wouldn’t either. And complexity only grows from here as some implementations require result paging, error handling, etc. forcing you to write custom code.

Manual export

If the above options are not possible, your last resort might be to use the vendor app and export the data manually. So much about automating the data integration…

Conclusion

When evaluating a cloud vendor, don’t forget to ask them how you can access your data. Extracting data by connecting to its native storage (typically a relational database) is the best option for integrating with cloud data sources, as the data is in its native format, you can fold operations, such as filtering and sorting, you can extract data incrementally, or even build SQL views if the vendor allows it. Unfortunately, the norm nowadays is to force you to call the vendor’s (often horrible) API, so the extraction effort in your ETL is on you and not the vendor.


Teo Lachev
Prologika, LLC | Making Sense of Data
Microsoft Partner | Gold Data Analytics

logo

Prologika Newsletter Winter 2021

Happy Holidays! More and more organizations consider data virtualization to abstract the underlying storage and integrate siloed sources. In this letter, I’ll discuss a real-life project that used PolyBase to expose third-party ERP data as SQL tables. Before I get to the subject of this newsletter, I’m excited to announce the seventh edition of my “Applied Microsoft Power BI” book. It should be available on Amazon in the first days of 2022. As far as I know, it’s the only book that is updated annually to keep it up to the date with the fast-changing Power BI. Stay tuned for a future blog with more details about the book.


Business Case

Think of data virtualization is a logical data layer that integrates enterprise data across various on-premises and cloud sources. A large, multinational chemical manufacturer decided to migrate their on-premises ERP system to the cloud. As usually happens, the tradeoff for embracing the cloud is losing access to your data in its native storage. Previously, the client could readily integrate the ERP data stored in a SQL Server database. But the ERP vendor didn’t support this option in their cloud offering. The usual explanation cites security and performance issues, although none of them really hold water. The ERP vendor could have supported a premium tier where data is exposed privately without affecting other customers, and report queries could have been redirected to a secondary replica. This is no different that securing and scaling an Azure SQL Database. Alas, as more and more companies find when embracing the cloud, the integration burden gets heavier and is on them and not on the vendor.

To make things even more difficult, the vendor had a replication mechanism to export the data to AWS S3 data lake. Realizing that most clients would struggle calling their REST APIs, the vendor provided an JDBC driver that abstracted the APIs. Great, except that the client wanted to access the data on Microsoft Azure, but no Microsoft tool supports JDBC drivers because no Microsoft BI tool is written in Java.

Integration Options

One integration option could have been to use a JDBC-capable ETL tool, such as Pentaho. But that would have required implementing integration pipelines to pull the data periodically and stage it on Azure. This presented two issues. First, the data integration effort became more difficult as someone had to own and troubleshoot ETL failures. Second, Business wanted as much real-time access to data as possible. In the past, the business users had implemented self-service Power BI models that they would refresh as needed to cache the data from the on-premises database. However, since the ERP vendor required at least 20 minutes for data changes to be applied to the S3 data lake and ETL needed additional time (even with incremental extraction), the data latency became an issue.

The second option was to somehow virtualize the data. Had the vendor supported exporting the data as files on Azure, Synapse Serverless could have been used to expose the data as virtual tables that can be queried with SQL and loaded in Power BI Desktop. But Serverless doesn’t support AWS S3 and even if it did, the vendor didn’t allow direct access to the staged data (REST APIs and JDBC driver were the only supported options).

PolyBase to the Rescue

The solution I proposed was to use PolyBase which is included in SQL Server and Azure SQL Managed Instance. Ideally, the client wanted a full PaaS solution but only PolyBase in SQL Server supports ODBC. So, we had to use an IaaS VM just to virtualize the data. This diagram shows the solution architecture.

An Azure VM was provisioned with SQL Server 2019 Standard Edition. The JDBC driver was installed on the VM and configured to access the ERP data. We used a third-party JDBC-to-ODBC bridge driver to map the JDBC data source as an ODBC data source. Then, PolyBase external tables were set up to virtualize the ERP data as SQL Server tables.

The main drawback of this solution was that no matter how small the source table was, PolyBase would add about 30 seconds in internal processing. Specifically, the PolyBase runtime log has a detailed trail that shows that it takes some time for PolyBase to “warm up” before it gets to the query, and then it needs even more time to process the results. That’s because, as a distributed system (like Synapse), a head node coordinates the query execution with data nodes even if everything is installed on a single VM. More gotchas specific to the fact that the vendor has decided to use Oracle as their relational database can be found at https://prologika.com/polybase-adventures/.

Conclusion

Microsoft has made bold strides in data virtualization. I’m really impressed by Synapse Serverless, which I used for other projects, such as for the project described in this case study. I wish Microsoft extends Serverless to support more storage options. If Synapse Serverless is not an option, your next best bet would be PolyBase. Although PolyBase is supported in SQL MI and Synapse, only the SQL Server box SKU supports ODBC data sources, requiring an IaaS layer to virtualize the data.

Benefits

The solution delivered the following benefits to the client:

  • No ETL effort – Data was left at the original source.
  • Data virtualization – Polybase was used to create external tables that can be queried just like SQL Server regular tables.
  • Reduced data latency – Data changes were available as soon as they are replicated to the data lake.
  • Scalability – PolyBase can be scaled out to other servers if needed.


Teo Lachev
Prologika, LLC | Making Sense of Data
Microsoft Partner | Gold Data Analytics

logo