Charting the Future
It is old news by now that Microsoft has acquired the intellectual rights to the Dundas Reporting Services controls, including the Dundas chart, map, gauge, and calendar. At this point, it is not known if all controls will make it to Katmai but the chart will definitely will. The July CTP (CTP4) includes a preliminary version of the Dundas chart that has been converted from a custom report item to a native region. Many of the properties are not hooked yet but you can witness some of the new enhancements. Although somewhat unpolished, the following report demonstrates some of these features.
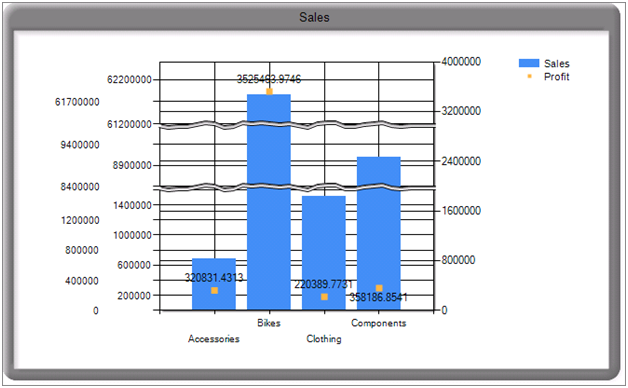
The report features two charts in one – a column sales chart and a scattered profit chart. They are projected on two value axes. Having a secondary axis wasn’t supported by SSRS 2005. Also, the first value axis has axis breaks. Since the Bikes sales exceed by far the sales of the other categories, an axis break on Sales is used to prevent the Bikes sales to eclipse the other categories. This wasn’t possible before. Now, it is matter of enabling a checkbox. The chart region will compute the axis break automatically for you.
Of course, this just scratches the surface. The Dundas chart control is one of most complex and powerful controls on the market. The bottom line is that SSRS 2008 will definitively pretty up your reports and dashboards.


