Choosing a Reporting Tool
Next to the question “How do I offload reporting effort from IT?” is “Which MS reporting tool should my users use?”. Granted, Microsoft BI is not shy of reporting tools and they number is increasing! And with Power BI reports soon to be available in SSRS, the choice is getting even more difficult. The following diagram illustrates how I position reporting tools. The Y-axis represents complexity which measures the skills required to author different report types. The X-axis is for interactivity that is related to how well the tool supports interactive data exploration. The size of the bubble represents features supported by the tool – the bigger the bubble, the more features the tool supports. Of course, “features” are subjective. For example, if you care about ability to use custom visualizations, then Power BI reports should be very appealing to you (SSRS also supports custom visuals but you have to code them in .NET). The dividing dotted line denotes who typically creates and owns the report type: IT or Business.
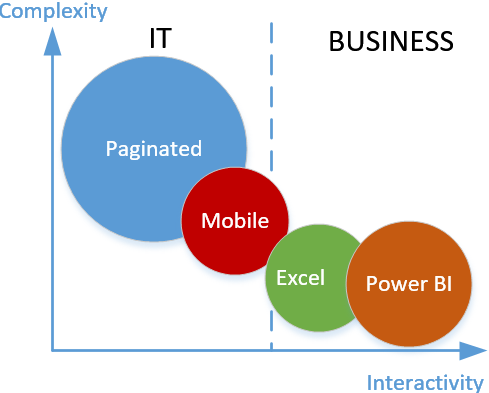
SSRS traditional (now called paginated) reports are the Jupiter in the MS BI Report Tools galaxy. You can rarely have a requirement that you can’t meet with SSRS reports because they are highly customizable. While they exceed in customization, paginated (also referred to as canned) reports lack in interactivity. They are typically authored and owned by IT. However, I have customers where business users have adopted Report Builder to create basic tabular and chart reports. So, don’t rule out this scenario although it requires a steeper learning curve than using Excel or Power BI Desktop for example.
As I mentioned a while back when I had a first look at the new mobile reports (they came from the Datazen acquisition), I have a positioning problem with mobile reports that debuted in SSRS 2016. That’s even more true given that that SSRS will soon support Power BI reports that can be optimized for mobile devices too. Chris Finlan (Senior Program Manager at Microsoft) is more excited about mobile reports and he listed some good usage scenarios. The problem is that in my opinion this report type is neither interactive enough nor feature-rich enough. Because of its reliance on SSRS datasets, mobile reports are typically owned by IT (at least setting up the data) and its primary usage is creating semi-interactive reports that render well on mobile device. If you’re familiar with RoamBI or former PushBI (now a part of Tibco), this is the Microsoft competing reporting technology.
Excel reports are easy to position since many business users live and die by Excel. If pivot reports are good enough for your users, look no further then Excel. The problem with Excel reports though is that they are not supported by SSRS yet (rendering Excel reports online in SSRS is on the roadmap). You can deploy Excel reports with imported data, such as in Power Pivot model, to Power BI Service (powerbi.com). However, Excel reports connected to external data sources, such as Analysis Services, are not supported in Power BI or SharePoint Online (currently, the only choice for online rendering of Excel reports connected to SSAS is deploying them to on-premises SharePoint Server).
If your users are interested in interactive analysis and data exploration, the easy choice is Power BI reports considering all the investment Microsoft is making in Power BI.
This is the Microsoft competing report tool to Tableau, Qlik, etc. These reports can be shared online by publishing them to the cloud (Power BI Service) and soon to on-premises SSRS in native mode (currently you can publish them to SSRS 2016 in native mode but users have to download and open them in Power BI Desktop).
Finally, as any other reporting tool on the market, there isn’t a Microsoft reporting tool that does it all. Most customers use multiple tools. My high-level advice is to have a limited number of strategic SSRS paginated reports and use Excel and/or Power BI for self-service interactive reports.
Remember, data integration first, then data quality, then visualizations.


