-
Reporting Services 2008 Online Training Class with Teo Lachev
August 17, 2009 / No Comments »

There is still time to sign up for our Applied Reporting Services 2008 class with Teo Lachev. This three-day intensive event teaches you the knowledge and skills you need to master Reporting Services to its fullest. No travel, no hotel expenses, just 100% in-depth SSRS training delivered right to your desktop! Applied Reporting Services 2008 Online Training Class with Teo Lachev Date: August 31 – September 2, 2009 Time: Noon – 4 pm EDT; 9 am – 1 pm PDT 12 training hours total for only $799! Attend this class for only $799 and get a free paper copy of the book Applied Microsoft SQL Server 2008 Reporting Services by Teo Lachev! For more information or to register click here!
-
SQL Server 2008 R2 August Community Technology Preview Available
August 14, 2009 / No Comments »
Microsoft released SQL Server 2008 R2 August Community Technology Preview which includes the Report Builder 3.0 R2 August CTP redistributable.
-
Reports as Data Feeds
August 14, 2009 / No Comments »
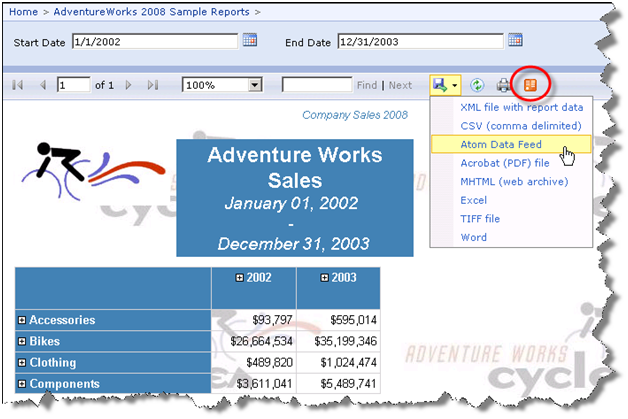
Reporting Services SQL Server 2008 R2 features reports as Atom data feeds. This is accomplished with a new Atom Data Feed extension, as shown on this screenshot. This extension produces an atom service document (an *.atomsvc file). It lists at least one data feed for each data region in a report. In fact, some regions, such as tablix with column groups (cross-tab report layout) may generate multiple feeds. At this point, you probably imagine subscribing to reports and receiving feeds in Outlook when report data is changed. Unfortunately, you won't get very far doing so. As it turns out, atom data feeds are different from Atom feeds that most applications, such as IE and Outlooks understand directly. So even if you extract the Url out of the service document and display the .atom rendering of a report in IE, the browser won't show useful information because it doesn't understand that...
-
Reporting Services Lookup Functions
August 13, 2009 / 1 Comment »
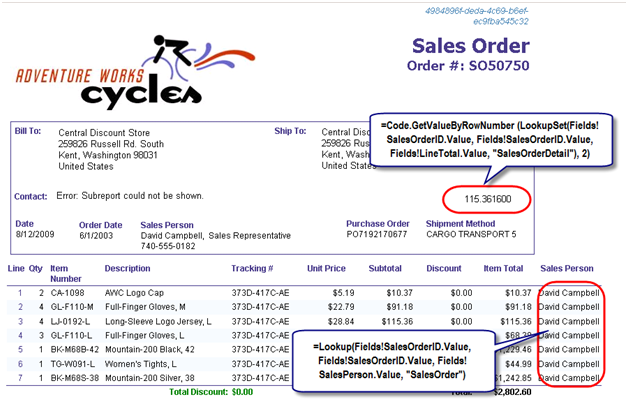
One new SSRS SQL Server 2008 R2 feature that caught my attention is lookup functions. When reading the Reporting Services discussion list, I come frequently across questions that ask if it is possible to look up a value from a dataset other than the dataset the region is bound to. Excluding getting the first or last value (First and Last functions) or aggregate functions that work on the entire dataset, the only solution was to cache the dataset in a report code-behind code and use custom code to perform the navigation. R2 will change this by introducing Lookup, LookupSet, and Multilookup functions. The lookup functions are best understood with an example. Take a look at this report (attached) which is based on the Sales Order Detail 2008 report that ships with the Adventure Works sample reports. I added a couple of textboxes to the report. The order details section includes...
-
The Dazzling R2 Report Manager
August 12, 2009 / No Comments »
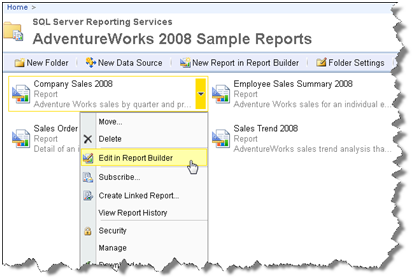
In this and future blogs I'll cover the most important new features in the forthcoming release of Reporting Services which will be included in SQL Server 2008 R2 (code-named Kilimanjaro or KJ for short). Let's start with the most obvious new feature: the all new Report Manager UI. SharePoint-like UI The moment you open Report Manager, you will notice that significant work was done to make the UI more intuitive, a la SharePoint. For example, similar to SharePoint, a drop-down context menu pops up when you hover on a report item that lets you quickly access relevant tasks. Simplified UI The management pages also received facelift. Microsoft has reduced the number of buttons and changed the tab styling so you are sure which tab is selected. Although seemingly minor, I am sure you'd love the new look and feel. For example, I like the fact that I don't have run...
-
New Reporting Services Features in SQL Server 2008 R2 CTP2
August 11, 2009 / No Comments »
It turned out that for time being the CTP2 of SQL Server 2008 R2 which I announced yesterday is available for TAP participants only. It will be publicly available on Wednesday. Meanwhile, Robert Bruckner listed the new Reporting Services features which got implemented in CTP2. The biggy is the new map region that lets you visualize geospatial and geometry data. In my first book I had a sample that demonstrated how to export a report as a data feed. Well, in R2 this will be natively supported. Reports as data feeds, anyone? Visual Studio 2010 Beta 2 will include an AJAX Report Viewer. I would hope for a Silverlight version but one step at a time. Again, post your KJ-related question to the Reporting Services forum.
-
SQL Server 2008 R2 CTP Available
August 10, 2009 / No Comments »
Microsoft just pushed CTP2 of SQL Server 2008 R2 build #1092.20 (code-named Kilimanjaro).
-
SQL Server R2 Forums Available
August 10, 2009 / No Comments »
The SQL Server R2 (Kilimanjaro) discussion forums went live today. Your humble correspondent is the moderator of the Reporting Services forum. SQL Server R2 CTP 2 should be out on connect.microsoft.com shortly. Looking forward to your feedback!
-
SharePoint Integrated with Reporting Services on Windows Vista
August 7, 2009 / No Comments »
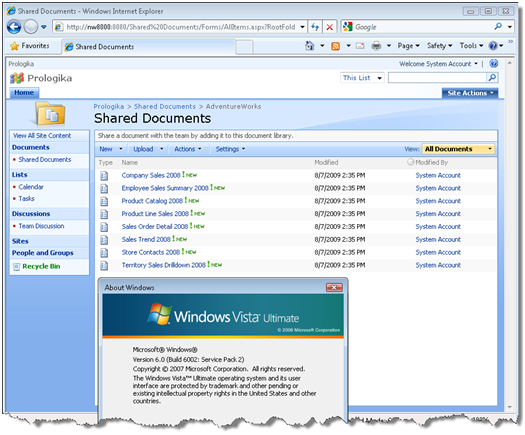
So, how's this not cool? Running SharePoint integrated with Reporting Services on Windows Vista! I've always had a grudge with SharePoint that it doesn't run on a desktop OS. This forces you to install Windows Server or use a virtual image, both options far from ideal. When I went to TechEd I blurted by disappointment to a couple of SharePoint gurus who clued me in (this is why we go to conferences, right, to learn the latest hacks) but I didn't have time to try it … until today. The solution is to use the Bamboo's workaround (OK, an ingenious hack) but it works like a charm. What about Windows 7 which has recently RTM'ed? Bamboo took care of that as well. I hope Microsoft will take a note and finally support officially SharePoint on a desktop OS. If SQL Server can scale down all the way to mobile devices,...
-
Nevron Charting for Reporting Services
August 1, 2009 / No Comments »
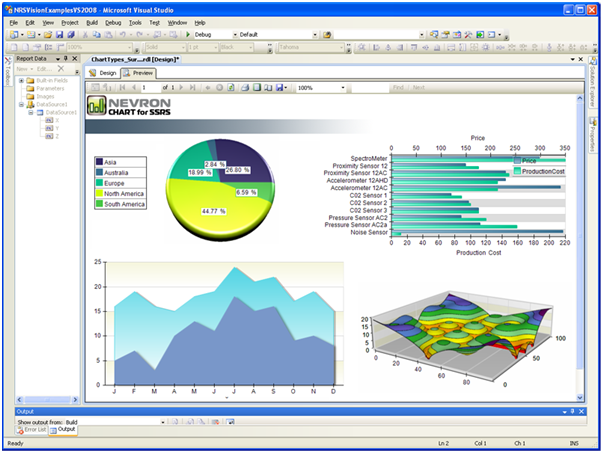
Reporting Services charting not enough? Nevron Software has released a Nevron Charting for Reporting Services which I haven't personally tested yet. According to the vendor, here are the major features where Nevron excels in comparison with Reporting Services charting: - Speed - Nevron Chart for SSRS is the fastest rendering chart inside Reporting Services - in both 2D and 3D modes. - 3D Charting - Nevron Chart for Reporting Services has the best layout in 3D and the most advanced feature set in 3D - including: 11 predefined lighting modes, ability to specify element materials (control the way in which elements reflect light), largest charting types set in 3D, biggest set of shapes in 3D (applicable to pies, bars, markers, areas etc.). - 2D Charting - Nevron Chart for Reporting Services is the only chart for Reporting Services to provide Adobe Photoshop like image filter effects, which are applicable to...
Training
 We offer onsite and online Business Intelligence classes! Contact us about in-person training for groups of five or more students.
For more information or to register click here!
Books
 Learn Power BI at your own pace with our latest book Applied Microsoft Power BI. Targeting information workers, data analysts, pros, and developers, It is designed as an easy-to-follow guide for learning how to implement BI solutions spanning the entire personal-team-organizational BI spectrum.


