Creating PBI Detail Reports
Related to the previous blog, let’s show how to create a detail report in Power BI that mimics an Excel PivotTable report in a flattened layout. Consider the report below. To create it, use the Matrix visual and add the necessary fields to the Rows bucket and measures to the Values bucket. By default and similar to Excel, Matrix would use a Stepped layout so that each time you expand a field, the next field would use the same column to minimize horizontal space. In the Format tab, in the “Row headers” section there is a setting “Stepped layout” that is easy to miss. When you switch it to Off, Matrix is now configured to mimic the Excel Tabular (flattened) report layout. Now right-click on the report each field that you want to expand, and then click “Expand to next level”.
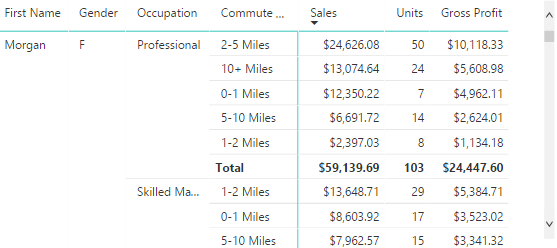
There are currently two limitations that I hope will be lifted soon. There isn’t an option to expand all fields in one step so you have to expand one field at the time. More importantly, currently there isn’t a way to disable specific totals. The “Total row” option in the Format tab toggles on/off all subtotals. Having report subtotals might lead to a performance issue (see my previous blog for more detail). UPDATE 8/14/2017 – The latter limitation has been lifted in the August release of Power BI Desktop, which now supports configuring row subtotals per level (turn the “Per row level” to on in the Subtotals section of the Format tab) .


