Data Models for Self-Service BI
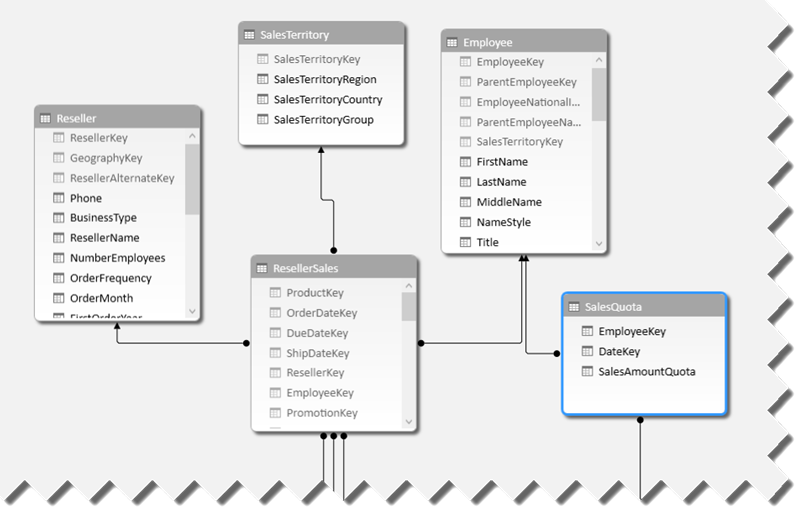
The self-service BI journey starts with the business user importing data. With Microsoft Power Pivot, we encourage the user to import tables and create relationships among these tables, similar to what they would do with Microsoft Access. This brings tremendous flexibility because it allows the user to incrementally add new datasets and implement sophisticated models for consolidated reporting, such as for analyzing reseller and internet sales side by side. True, Power Pivot relationships have limitations, including:
- The lookup table must have a primary key and the relationship must be established using this key. As it stands, Power Pivot doesn’t support multi-grain relationship where the fact table joins the lookup table at a higher grain than the primary key.
- Many-to-many relationships (such as a joint bank account) are not natively supported and currently require simple DAX formulas to resolve the relationship, such as CALCULATE ( SUM ( Table[Column] ), BridgeTable)
- Closed loop relationships (Customer->Sales->Orders->Customer) are not allowed, etc.
The chances that these constraints will be relaxed in time as Power Pivot and Tabular evolve to allow you to meet even more involved requirements on a par with organizational BI models.

With the recent popularity of other tools for self-service BI tools, I took a closer look at their data features. Tableau, for example, encourages users to work with a single dataset. If the user wants to import data from multiple tables, the user must create table joins to relate the tables before data is imported in order to create a dataset that has all the required data. This probably meets 80% of self-service BI requirements out there although it might preclude consolidated analysis. Suppose you want to analyze reseller sales by customer. With Tableau, you need to join the Customer and ResellerSales tables in order to prepare the dataset and that’s probably OK to meet this requirement. At some point, however, suppose you need to bring also Internet sales which are stored in a separate table. Now you have an issue. If you opt to change the dataset and join the Customer, ResellerSales, and InternetSales, you’ll end up with duplicated data because you can’t join ResellerSales to InternetSales (they don’t have a common field). In Power Pivot, you could simply address this by importing Customers, ResellerSales, and InternetSales as separate tables and creating two relationships Customer->ResellerSales and Customer->InternetSales. Notice that a Power Pivot relationship happens after the tables are imported although it’s possible of course to establish a data source join during the data import. A Tableau workaround for the above scenario would be to go for “data blending”. Speaking of which…
It’s also interesting how Tableau addresses combining data from separate data sources. Referred to as “data blending”, this scenario requires the user to designate one of the data sources as primary and specifying matching fields from the two data sources to perform the join. Behind the scenes, Tableau executes a post-aggregate join that aggregates data at the required grain. Let’s say, you import the Customer table from Data Source A and InternetSales table from Data Source B. Suppose that both the Customer and InternetSales datasets have a State field which you want to use for the join. With data blending, Tableau will first aggregate the InternetSales dataset at the State level (think of SUM(SALES) FROM … GROUP by STATE) and then join this dataset to the Customer dataset on the State field. The advantage of this approach is that you can join any two datasets as long as they have a common field (there is no need for a primary key in the Customer table). The disadvantage is that the secondary data source can’t be joined to another (third) data source. Further, this approach precludes more complicated data entity relationships, such as many-to-many.
When choosing a self-service BI tool, you need to carefully evaluate features and one of the most important criteria is the tool data capabilities. Some tools are designed for one-off analysis on top of a single dataset and might require importing the same data to meet different reporting requirements. Power Pivot gives you more flexibility but requires end users to know more about data modeling, tables and relationships.


