DAX Variance Calculations
Variance calculations are a common BI requirement but good reference material is lacking. How do we create them in DAX? Let’s say you need to calculate the variance between this month sales and the previous month sales.
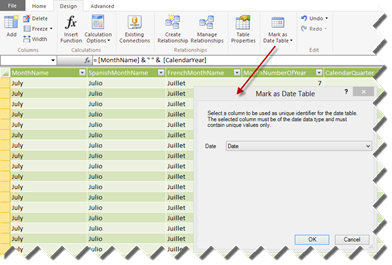
- DAX date functions require a Date table. They won’t work if you don’t have a separate Date table. They also require that you tell PowerPivot (or Tabular) about your Date table. So, as a first step select the Date table, go to the Design ribbon, and then click Mark as Date Table. PowerPivot will infer the column of the date data type (you must have such a column).
- Sort the Month column with custom sort. For example, if your Month column returns the month in MMM-YY format, sort that column by another integer column in the format YYYYMM. More on this in a moment.
- Define a new calculated measure using the following formula:
=SUM(ResellerSales[SalesAmount]) – CALCULATE(SUM(ResellerSales[SalesAmount]), PREVIOUSMONTH(‘Date'[Date]))
What’s going on here? The formula needs to work irrespective of the month on the report. In other words, if we put months on columns, each month will act as of that month. That’s why we need a calculated measure. The first SUM returns the aggregated sales for the month. The CALCULATE function is used to overwrite the context because we want to get to the last month sales. To do this, we pass the PREVIOUSMONTH function as a second argument and point it to use the Date column in the Date table as we do with other DAX date-related functions.
Here is something important. This report won’t work with just months on columns if your Month column returns the name of the month only. That’s because the month name will be repeating across years. This is why the PREVIOUSMONTH documentation insists on having both year and month on the report.
“To see how this works, create a PivotTable and add the fields, CalendarYear and MonthNumberOfYear, to the Row Labels area of the PivotTable.”
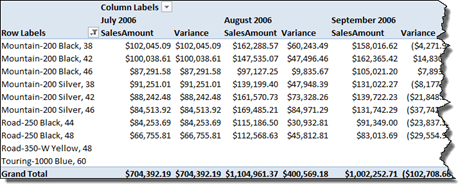
If you don’t want to add the year to reports, add a MonthName calculated column to your Date table with the following formula: = [MonthName] & ” ” & [CalendarYear] that makes the month unique across years and another column MonthNameSort to sort by with the following formula: =[CalendarYear] * 100 + [MonthNumberOfYear]. Then sort the first column by the second. To do this, in the PowerPivot window, click any cell in the MonthName column. Then, in the Home ribbon, click the Sort by Column button and choose the MonthNameSort as the sort by column. Use the MonthName column on the report, as I’ve done in the screenshot above.
Further considerations:
- If you want to calculate a variance between parallel periods, use the DAX ParallelPeriod() function.
- While a clumsy way exists in PowerPivot Tabular to handle multiple relative dates (see the “Calculating many time periods within a single measure formula” section in the DAX Samples white paper), the formulas must still reference a specific measure, e.g. SalesAmount. That’s because Tabular doesn’t currently support scope assignments that allow you to create generic “shell dimensions” spanning multiple measures.
- What if you want the variance to work across months, quarters, and years? Because Tabular doesn’t support functions for hierarchy navigation and no PreviusPeriod() function exists, you have to resort to the DAX Samples workaround to adjust the formulas depending on what level you are in the Date hierarchy, such as to use PreviousMonth() if you are at the month level and PreviousYear() if you are at the year level.


