Integrate SSRS 2016 Reports with Power BI
As I said in the “Microsoft Unveils BI Roadmap” blog, SSRS will play an important role of the on-premises BI portal. With this post, I’ll start covering the new SSRS 2016 features. One of the Power BI features announced at the PASS Summit was the forthcoming integration between SSRS 2016 and Power BI that will allow users to pin SSRS report items to Power BI dashboards. You can test pining reports items to Power BI with SQL Server 2016 CTP 3.0 and later. The newly released CTP 3.2 also features the new sleek SSRS portal (we’ve come a long way!). The items you can pin currently include charts, gauge panels, maps, and images. Pinning a report item takes a few clicks:
- Open the report and click the Power BI button (a new toolbar button in SSRS 2016). If this is the first time you do this, you’ll be asked to authenticate with Power BI and grant SSRS special permissions it needs for pinning. Then, SSRS switches to a special page mode that shows which items can be pinned.

- Click the tile you want to pin.
- In the “Pin to Power BI Dashboard” window, select the dashboard you want to pin the report to and the update frequency that specifies how often Power BI will query the report for data changes.

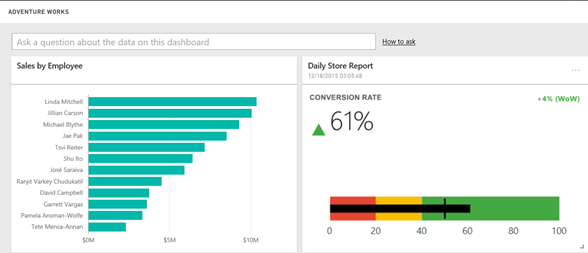
And, the report item is pinned to the dashboard as a regular tile. You can click the tile to navigate back to the SSRS report.
As you can see, Power BI is becoming a focal point for cloud hosting of the main MS report artifacts: Power BI reports, Excel reports, and SSRS reports.


