Nevron Charting for Reporting Services
Reporting Services charting not enough? Nevron Software has released a Nevron Charting for Reporting Services which I haven’t personally tested yet. According to the vendor, here are the major features where Nevron excels in comparison with Reporting Services charting:
– Speed – Nevron Chart for SSRS is the fastest rendering chart inside Reporting Services – in both 2D and 3D modes.
– 3D Charting – Nevron Chart for Reporting Services has the best layout in 3D and the most advanced feature set in 3D – including: 11 predefined lighting modes, ability to specify element materials (control the way in which elements reflect light), largest charting types set in 3D, biggest set of shapes in 3D (applicable to pies, bars, markers, areas etc.).
– 2D Charting – Nevron Chart for Reporting Services is the only chart for Reporting Services to provide Adobe Photoshop like image filter effects, which are applicable to all chart elements – these include bevel, emboss, lighting filters etc. When it comes to shadows it is the only chart for Reporting Services which has soft shadows (based on Gaussian and Radial blur image filters).
– 2D/3D Consistency – Nevron Chart for Reporting Services is consistent in 2D/3D modes. For example you can map gradients, textures to elements in both 2D and 3D. Colors specified in 2D are inherited by materials in 3D. You can mix 2D and 3D chart areas in a single chart control.
– Visual Effects – Nevron Chart for SSRS introduces numerous Lighting Models; Orthogonal Projection with Depth Offset (perfect for creating 2D half imitation charts); Soft Shadows based on image filters; Blur, Glow, Lighting, Bevel and Emboss image filters.
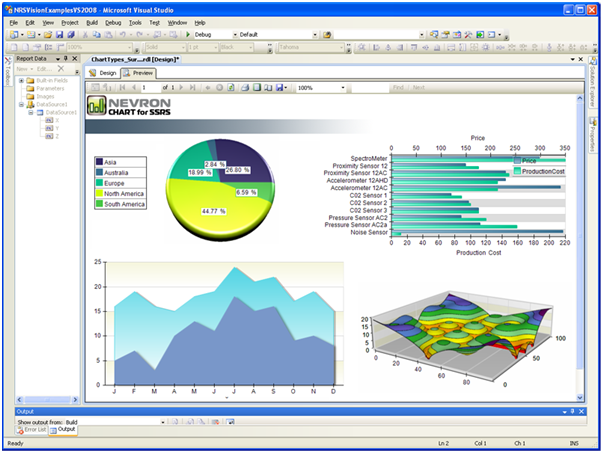
– Numerous XY and XYZ scatters – Nevron Chart for SSRS includes the industry leading support for XY and XYZ scatters inside Reporting Services.
– XML Formatted Texts – Nevron Chart for Reporting Services supports XML Formatted Texts. This feature is applicable to all elements which display text. It allows you to mix fonts, mix bold, italic underline formatting and many other advanced features like different fill styles, shadows, image filters etc. – all inside a single label, title etc. XML formatted texts use a format similar to HTML, but with many more advanced options.
– Multithreaded UI – The user interface in design time is multithreaded. This allows for very quick editing of the component, regardless of the preview complexity
– Save/Load Templates (available in Vol.2).
– Ability to inject custom code and to author the generated chars programmatically (code editor) (available in Vol.2).
Unique charting types:
– Surface Chart Series (Grid, Mesh and Triangulated).
– XYZ Scatter Series (Bar, Line, Point, Bubble, Float Bar).
– Financial charting types Renko, Kagi, Three Line Break, Point and Figure (available in Vol.2).
Major Chart Axis Features:
– Multiple X and Y Axes.
– Axes can be docked or crossed.
– Many scale options including support for Categorical, Hierarchical, Logarithmic, Numeric, Date/Time and Time Line scales.
– Control over the range and appearance axes.
– Scale sections
Nevron is also working on SharePoint charting which will combine their charting technology with the new Nevron Pivot Data Aggregation engine.


