Power BI Nested Hierarchical Labels
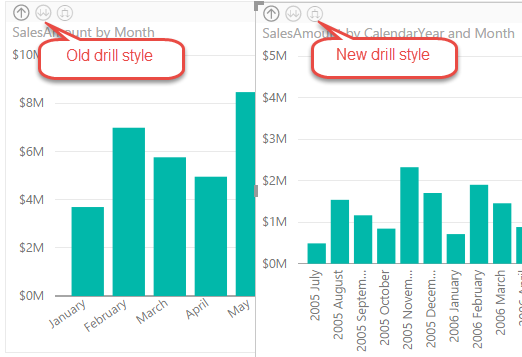
In the latest Power BI Desktop update, Power BI introduced a new drill-down option. Previously, after enabling drill-down on a chart and clicking the double-arrow icon, the chart will drill down to the next field in the Axis area (or to the next level of a hierarchy if a hierarchy is added to the Axis area). A student attending my Power BI class asked me this week how to avoid aggregation across all years if the user drills down from Year to the Month level. A few days ago, the only option was to introduce another Month field that has the Year-Month combination, e.g. 2005 July, 2005 August, and so on. Now, with the new drill down style, the chart will nest the hierarchical levels so you don’t have to add a new field. This behavior is similar to how Excel show categories nested in PivotChart.