Power BI vs. Tableau (Part 1)
As I mentioned in my blog “Why Business Like Yours Choose Power BI Over SiSense”, expect attack from other vendors to intensify as they find themselves fighting an increasingly uphill battle against Power BI. As we’ve seen, Power BI has indeed disrupted their sales cycles. In this blog, I’m reviewing the “10 Ways Power BI Falls Short” presentation that Tableau has published on their site. Tableau, of course, is a fine tool for what it’s designed to do – mainly self-service BI. But as we’ve all seen tools come and go as seasons. A few years ago it was all about Qlik, then Tableau, and now 2016 seems to be the year of Power BI. My advice has always been that the focus should be on sound strategy, data integration, and data quality, and not tools. The last thing you want is a “cool” tool that over promises but under delivers and you’re left with nothing when you decide to move on (and some of the vendors really cross the line during their sales pitch). So, we have to keep them honest!
Anyway, let’s take a look at some the claims that Tableau has made by going through their slides. This is, of course, a one-sided perspective that extolls the Tableau virtues. I plan a future post “10 Ways Tableau Falls Short” to fill in the gap. Also, Tableau should get in the habit to update this document frequently given the fact that Power BI changes weekly and some of the claims are no longer valid.
- Missing outliers are lost insights – Tableau has a point here. For some obscure reason, Power BI developers has decided to apply a data reduction algorithm to favor performance over details. True, this might result in lost outliers with thousands of data points. I recommend Microsoft allow end users to adjust the data reduction settings. I know this limitation is high on the wish list and I expect it to be addressed/lifted really soon. UPDATE 9/13/2017 – As of this date, all Power BI visuals except map supports rendering of all data points. UPDATE 1/8/2017 – As of the December 2017 update of Power BI, maps are high-density too.
- Difficult to answer easy questions – This refers to the fact that currently Power BI doesn’t support auto-generating common calculations. Fair enough, Power BI doesn’t support this yet but the statement “you’ll need to learn DAX first” is somewhat overloaded. There are plenty of DAX examples online of how to implement common calculations so there isn’t that much to learn. And DAX is much more powerful than Tableau expressions. UPDATE 10/1/2016 – Power BI introduced Quick Calc with the Percentage of Total being the only one currently available. UPDATE 4/3/2017 – Better yet, Power BI introduced Quick Measures, which supports various prepackaged calculations and show the DAX formula.
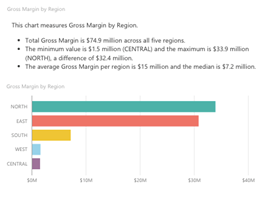
- No trends or forecasting available – Power BI just added trendlines. For now, forecasting needs to be done either in Excel or R. I don’t know why Power BI still hasn’t picked the linear forecasting capabilities that Power BI for Office 365 had. Another feature that is very high on the wish list so I don’t expect you have to wait long for forecasting. UPDATE 10/1/2016 – Power BI added time series forecasting. It also added Explain Increase/Decrease machine learning algorithms in Power BI Desktop.
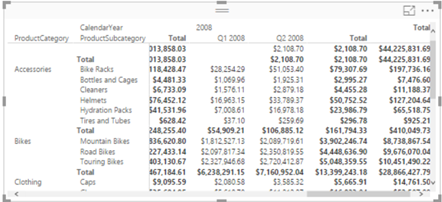
- You can’t compare several categories – If I understand this correctly, it refers to ability to drill down across multiple categories. Power BI matrix reports should get the job done. Also, Power BI has recently added the ability to drill through chart data points.

- Filtering is tough – Tableau is correct that Power BI doesn’t support context filtering but the statement “You’d have to take the time to filter everything around it, one-by-one, instead” is overloaded. It shouldn’t be that difficult to filter out values using visual-level, page, or report filters. It might take a few more clicks, but I won’t consider this to be a major limitation.
- Half the details = Half the insight. True, Power BI tooltips are not yet customizable. Should important information be in tooltips though and require hovering from one point to next? UPDATE 10/1/2016 – Tooltips are now customizable.
- Organizing your data is difficult – True, Power BI doesn’t support dynamic groups, e.g. by lassoing some scatter points. I personally haven’t heard users complaining or asking about it so I don’t consider it to be a major limitation. Power BI does support hierarchies. UPDATE 11/1/2016 Power BI Desktop October Release introduced dynamic groups and binning in charts.
- No offline iterations allowed – “In Power BI, you can do some basic web editing, but you can’t download it to your desktop or work offline” This is incorrect. First, web report editing it’s on a par with desktop editing. Second, a best practice is to create your reports in Power BI Desktop and upload to powerbi.com. If you do this, you can download the pbix file and work offline. Moreover, Tableau web editing has more limitations than Power BI.
- You can’t tell a story – Outdated. Power BI added a Narratives for Power BI. Coupled with Quick Insights, these features surpass the Tableau capabilities. UPDATE 10/9/2017 Power BI also added bookmarks, selection pane, and spotlight.
- You can’t ask what-if questions – True, Power BI doesn’t support What-If natively yet. If this is important, you can export the visual data to Excel and use the Excel what-if, goal seek, and scenario capabilities. UPDATE 9/13/2017 – August release introduced What-If parameters and analysis
Overall, I believe that some of the points Tableau makes are insignificant while Power BI has already addressed others. Agree? Stay tuned for a “10 Ways Tableau Falls Short” blog.


