Prologika Newsletter Fall 2017
Business Performance Management
 As I’m writing this newsletter, Florida and Georgia (I live in Atlanta, GA) are in the midst of planning for hurricane Irma, which is expected to be one of the most powerful Atlantic Ocean hurricanes in recorded history. I hope that this won’t be the case and we don’t have to deal with a disaster of the magnitude of hurricane Harvey that took place just two weeks ago in Houston, TX. To avoid and mitigate this, a great deal of planning happens at every level: from government to citizens. Did you know that over 5 million of people in Florida were evacuated, making this the biggest US displacement of people to date? Speaking of planning, how does your company approach Business Performance Management? Do you use Excel spreadsheets or expensive high-end planning software? Next, I’ll share how Prologika helped a large organization improve its budgeting and planning process, powered by a cost-effective solution based on Microsoft BI.
Why Business Performance Management?
Wikipedia defines Business Performance Management (BPM) as “a set of performance management and analytic processes that enables the management of an organization’s performance to achieve one or more pre-selected goals”. A simpler BPM definition might be a methodology to help the company predict its performance. An integral part of a BPM strategy is a process for Budgeting, Planning, and Forecasting that typically has the following workflow:
- Every planning year, a planner in the Financial department creates a budget for a certain number of future periods. The budget is revised and multiple versions are proposed to management. Once budget is approved, it becomes fixed for the duration of the planning year.
- As actuals come in, the planner works on forecast scenarios. Multiple forecast scenarios are typically prepared as the planning year progresses over time.
- The planner monitors the variance between actuals and budget, actuals and forecast versions, and between forecast versions to improve the planning accuracy.
Business Needs
When it comes to Finance, nothing is simple and BPM is no exception. In fact, it very well might be that that your BPM solution might be the most complicated software you’ve ever developed. The temptation is to buy a prepackaged software but even that route would require a lot of customization and compromises. To gauge complexity, let’s look at some of the business requirements we faced.
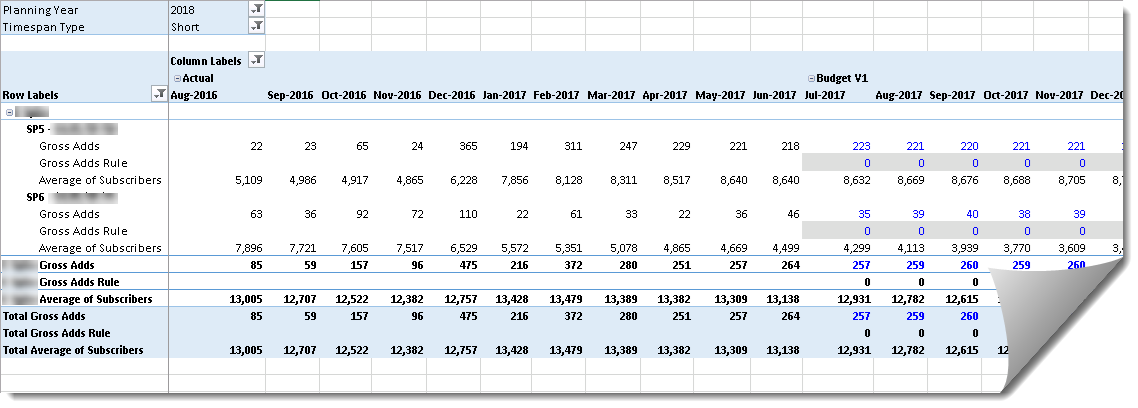
Similar to a Telco, this company has customers and service plans. As a B2B organization, their customers are other companies. Planning is done at the customer and service plan level, and across multiple subject areas. For example, the Excel report shows a subset of the measures for planning growth of the customer base. The planner can change the budget and forecast values of some measures, called drivers. For example, the planner can overwrite Gross Adds for future periods. Further, the planner can overwrite a rule in each cell to change how the driver cell value is computed. The rules are:
- 0 (default rule) – By default, planned values are calculated as 3-mo average of previous periods. For example, Gross Adds for Aug 2017 for the first plan is 221 and has a Gross Adds Rule of 0. This means that the system will calculate the value as a 3-mo simple average of the values of the previous three months (221, 218, and 223). Note that a previous month might fall in the Actuals range. Also notice that recursive calculations are required, where the value of each month is based on the same measure for previous periods.
- 1 (6-mo average) – Instead of 3-mo average, 6-mo average is used.
- 2 (seasonality index) – The value is computed by multiplying the driver values for the past 12 months by a seasonality index.
- Any other value – The planner enters the driver value manually.
The driver measures are used to calculate other (output) measures. For example, Average of Subscribers has a formula that is based on Gross Adds and other measures. Finally, the drivers and output measures are allocated across a Chart of Accounts dimension (not shown on the report) to give managers the financial perspective of how the company is doing.
The Solution
Previously, the company has used an Excel-based home-grown solution. However, the process was manual, lengthy, error-prone, and it couldn’t give management a quick and accurate picture of the company’s performance. A Business Analytics group was responsible for retrieving and consolidating actuals. Then, the Finance group would manually input actuals into an Excel template. Complicated Excel formulas were used to calculate drivers and output measures but even Excel had difficulty with more complex recursive measures. Most of the time and effort was spent on working the system than on business performance management. The company looked at other high-end financial solutions, with a starting price tag of $300K, plus yearly maintenance fees and consulting feeds. At the end, the company entrusted Prologika to implement the solution.
We used Analysis Services 2016 Multidimension, Initially, we considered Tabular but we realized that the solution complexity exceeded the Tabular capabilities, including:
- No support for writeback – Currently, Tabular doesn’t writeback although third-party solution such as Power Planner can be overcome this limitation.
- No support for recursive measures – Currently, Tabular doesn’t support recursive measures, where the measure DAX formula references the same measure.
- No scope assignments – Tabular doesn’t support scope assignments for allocations.
- No parent-child dimensions and hierarchy functions – Tabular doesn’t support parent-child hierarchies and functions for navigating the hierarchy, such as Parent, Children, etc.
This is a classic example of using the best tool for the job. While Tabular could be a good fit for perhaps 80% of semantic models out there, Multidimensional is probably your best bet for Financial projects and projects that require massive data volumes. No tool is perfect. “When all you have (know) is a hammer, everything looks like a nail” doesn’t work for BI.
MS BI Events in Atlanta
- Atlanta MS BI and Power BI Group: “Did Qlik run out of BI power?”presentation by Carlos Rodriquez on 9/25
- Atlanta MS BI and Power BI Group: “Topic: TBD” presentation by Slalom Consulting on 10/30
As you’d probably agree, the BI landscape is fast-moving and it might be overwhelming. If you need any help with planning and implementing your next-generation BI solution, don’t hesitate to contact me. As a Microsoft Gold Partner and premier BI firm, you can trust us to help you plan and implement your data analytics projects, and rest assured that you’ll get the best service. Regards,
Teo Lachev

Teo Lachev President and Owner
Prologika, LLC | Making Sense of Data
Microsoft Partner | Gold Data Analytics


