Prologika Newsletter Summer 2015
What’s New for BI in Office 2016?

While you might be still trying to convince management to upgrade to Office 2013, the next version of MicrosoftOffice (Office 2016) is on the horizon and scheduled to be released sometime in the Fall. Meanwhile, you can download and test the Public Preview. Naturally, you might wonder what’s new for BI given that Excel is the Microsoft premium BI desktop tool. In this newsletter, I’ll share my favorite Excel 2016 BI features (most significant listed first).
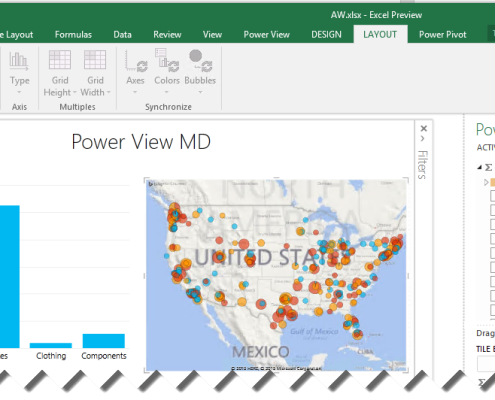
Power View Connectivity to Multidimensional Cubes
I don’t know why it took more than two years for Microsoft to add this feature (initially released for Power View in SharePoint), but you will be finally able to use Power View in Excel 2016 to connect to OLAP cubes, just like we can use Power View in SharePoint as a front end to cubes. What this means to you is that you can preserve your OLAP investment by allowing business users to use Power View to build dashboardsand perform ad-hoc data analytics.
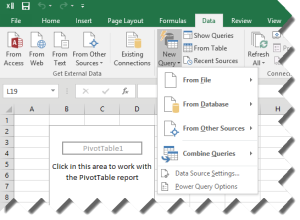
Native Power Query Integration
If you follow the Power Query story, you know that it has an increasingly popular place in the Microsoft BI strategy. In fact, all data roads in Power BI 2.0 go through Power Query because of its integration with Power BI Designer. Besides not having to go through extra steps to download and install Power Query, the native integration allows you to manipulate programmatically Power Query objects using VBA, C#, or PowerShell code and record macros, as explained in more details in this document.
Continuing down the integration path, you can now easily enable all “Power” features from File > Options > Advanced > Turn on data analysis features. In the past you had to enable add-in separately using File- >Options >Add-Ins > Manage “Com Add-ins” > Go.
Power Pivot Improvements
As you probably know, your business users can use Power Pivot to build sophisticated self-service BI models that are on a par with organizational models. Moving forward to Office 2016, the Power Pivot models will support many-to-many relationships. Unfortunately, this feature didn’t make it to the Office 2016 public preview but when released it should work in the same way as in the Power BI Designer. Continuing further down the list, you can now rename tables, columns and calculated fields/measures in the Power Pivot add-in and they will automatically propagate to Excel and existing reports. In another words, metadata changes are not breaking changes to existing reports anymore.
And it gets easier to define relationships. When you are building a Data Model PivotTable working with two or more tables with no relationships defined, you get a notification to run Automatic relationship detection. This will detect and create all relationships between the tables that are used for the Data Model PivotTable so that you don’t have to do any of the work yourself. DAX added many new functions which are documented here.
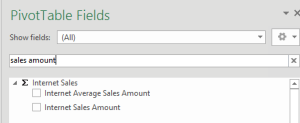
Usability Improvements
Another long anticipated feature made the cut. The Excel Field List added a Search feature to allow the end user to filter names of tables, columns, and measures. This works across all data structures: Power Pivot, Tabular, and Multidimensional.
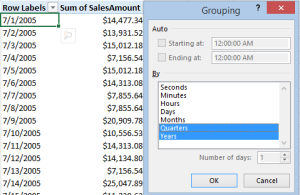
Similar to native pivot tables, pivot reports connected to Power Pivot models now support Time grouping. For example, this feature allows the end user to group a report at a day level to any time interval, e.g. year and then quarter.
Similar to native pivot tables, pivot reports connected to Power Pivot models now support Time grouping. For example, this feature allows the end user to group a report at a day level to any time interval, e.g. year and then quarter.
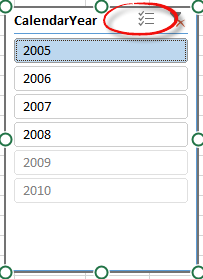
Excel regular slicers now add a multi-select option so that the user doesn’t need to remember to hold down the Ctrl key to select multiple items.
Forecasting Functions
Recognizing the need for time series forecasting, Excel adds forecasting functions, which are documented here. For example, the Forecast.ETS function predicts a future value based on existing (historical) values by using the AAA version of the Exponential Smoothing (ETS) algorithm. In the example below, Forecast.ETS calculates the forecasted value for the date in cell O16, using the historical values in the range P5:P15 across the dates in the time series from the range O5:O15).
=FORECAST.ETS(O16, P5:P15, O5:O15)
The function also supports arguments also for confidence interval and seasonlity.
As you’d agree, the BI landscape is fast-moving and it might be overwhelming. As a Microsoft Gold Partner and premier BI firm, you can trust us to help you plan and implement your data analytics projects.
Regards,
Teo Lachev
President and Owner
Prologika, LLC | Making Sense of Data
Microsoft Partner | Gold Data Analytics
EVENTS & RESOURCES
 Atlanta BI Group: Microsoft and Revolution Analytics: What’s the Add-Value? by Dr. Mark Tabladillo on June 29th
Atlanta BI Group: Sentiment Analysis with Big Data & Machine Learning by Paco Gonzalez on August 31th


