
Insurance Company Transforms Organizational Data Into Strategic Asset

Customer: eSecuritel
Website: https://www.esecuritel.com
Industry: Insurance
Customer Profile
eSecuritel is a phone insurance company dedicated to protecting all wireless devices against loss, theft, accidental damage, electrical/mechanical failure, virtual threats, and malfunction.
Value to Customer
Delivers actionable and instant data analytics.
Provides a single version of the truth.
Promotes better decision making.
Power BI partner showcase link
Insurance Company Transforms Organizational Data Into Strategic Asset
Industry: Insurance
InSight transforms the organization’s data into a key strategic business asset, empowering employees like never before. It currently includes over 300 performance measures that can be analyzed across various dimensions, enabling our business to calibrate and share insights with rich data storytelling. We are extremely excited for the actionable intelligence and foresight this new tool will bring to our organization!
Andrew Teeple, Director Supply Chain Analytics
eSecuritel, a Brightstar company, needed a BI solution to help them understand and act upon their business.Prologika implemented an innovative self-service BI solution. InSight not only has self-service BI capabilities but provides the organization with a “single version of truth”.
Business Needs
Historically, reporting and analytics at eSecuritel used to be an exhaustive process, impacted by constant changes in the transactional data that made it challenging to report measures consistently across the organization.
When eSecuritel approached Prologika, they gave us a wish list of metrics that they wanted to track across the enterprise. This wish list was compiled by their data analysts but even management was skeptical that the “dream” can materialize one day. The complexity of the source data and the lack of in-house BI expertise influenced the perception that actionable BI remains an unattainable dream.
Solution
InSight is powered by SQL Server Enterprise Edition. The system extracts the transactional data form the source systems and then loads the data into an Operational Data Store (ODS). ODS keeps the raw data in its original form but tracks historical changes.
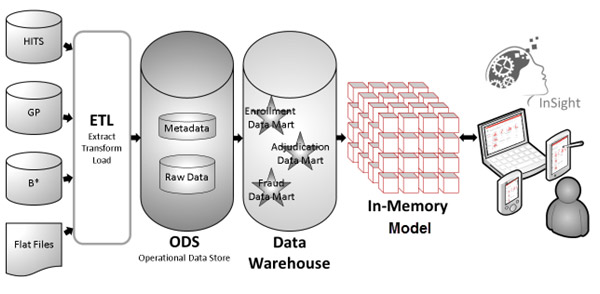
Another set of ETL processes loads the data into a data warehouse database. When doing so, ETL cleans the data and transforms it into a star schema format that is suitable for reporting. As typical with our organizational BI solutions, Prologika implemented a semantic data model powered by SQL Server Analysis Services. Read our “WHY SEMANTIC LAYER?” newsletter to learn more about the advantages of having a data model.
Benefits
The semantic data model brought several important benefits to business users.
- Great performance – BISM is optimized to aggregate data very fast. Queries involving regular measures and simple calculations should be answered within seconds even, when aggregating millions of rows!
- Implicit relationships – The semantic layer includes relationships between entities. As a result, end users don’t need to join tables explicitly because the relationships have already been established at design time. For example, a business user doesn’t need to know how to join the Date table to the Claims table or write SQL. You simply add the fields you need on the report, and then the model knows how to relate them!
- Interactive data analysis – From an end-user perspective, data analysis is a matter of dragging and dropping attributes on the report to slice and dice data. Power BI auto-generates report queries, and the server takes care of aggregating data, such as to summarize sales at the year level.
- Data security – BISM models apply data security based on the user’s identity, such as to allow a business analyst to access only the subject areas he’s authorized to access.
Single version of the truth
InSight centralizes business logic and metrics in the semantic model so that they are not defined and redefined in the database or in reports. The model includes over 300 metrics to support comprehensive descriptive analytics, such as averages, variances, growth, ratios, and many more.
Interactive data analysis
From an end-user perspective, data analysis is a matter of dragging and dropping attributes on the report to slice and dice data. Reports tools, such as Power BI and Excel, auto-generate report queries, and the server takes care of aggregating data, such as to summarize sales at the year level. With a few clicks, users can gain insights across multiple subject areas, such as claims, enrollment, and customer care.
The semantic layer includes relationships between entities. As a result, end users don’t need to join tables explicitly because the relationships have already been established at design time. For example, a business user doesn’t need to know how to join the Date table to the Claims table or write SQL. You simply add the fields you need on the report, and then the model knows how to relate them!
Instant self-service analytics
Data analysists don’t have to rely on IT anymore to provide the needed data to them. And they don’t have to create disjointed Excel “spreadmarts”. Now they just connect their favorite report tool to the data model and select which measures and dimensions they need on the report. Moreover, the data model is optimized to aggregate data very fast. Queries involving regular measures and simple calculations should be answered within seconds even, when aggregating millions of rows!


