Tabular M2M Relationships on the Horizon
One of the biggest strengths of Microsoft self-service BI is the ability to create sophisticated data models on a par with organizational BI models built by professionals. This fact is often overlooked when organizations evaluate self-service tools and the decision is often made based on other factors but not insightful understanding of the data model capabilities. This is unfortunate because most popular tools on the market don’t go much further than supporting a single dataset. By contrast, Power Pivot allows you to import easily multiple datasets from virtually anywhere and join the resulting tables as you can do in Microsoft Access. This brings tremendous flexibility and analytical power.
Unlike multidimensional cubes, one of the limitations of the Power Pivot and Tabular data models has been the lack of support for declarative many-to-many relationships. The workaround has been using a simple DAX formula to resolve the relationship over a bridge table, such as =CALCULATE (SUM (Table[Column] ), <BridgeTable>) but this approach might present maintenance issues, as you have to create multiple calculated measures to support different slicing and dicing needs. However, as pointed out in my latest newsletter, the upcoming version of Power BI aims to remove adoption barriers and adds new features. And, one of this features, is bidirectional relationships and declarative support of M2M relationship, which Chris Webb already wrote about.
To test the M2M relationship, I attempted to create the same M2M scenario that I used in my book, which models a joint bank account. The corresponding Power Pivot schema is shown below. The CustomerAccount table is the bridge table that resolves the M2M relationship (a customer might have many accounts and a bank account might be shared by multiple customers). The Balances table stores the account balances over time and the Date table lets us analyze these balances over time.

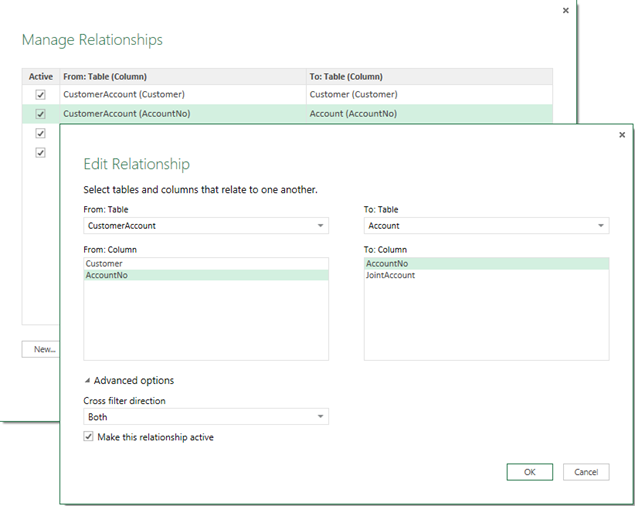
Setting up a M2M relationship in the Power BI Designer is achieved by changing the “Cross filter direction” relationship setting to Both. This setting and bi-directional relationships are described in more details here.
Indeed, creating a report that shows balances by customer resolves the M2M relationship and aggregates correctly.

Unfortunately, attempting to slice the report by Date returns an error in the preview version of the Power BI Designer so the M2M feature is still a work in progress. Brining this further, a useful addition could be declarative semi-additive functions to allow the user to set the aggregation behavior of the Balance measure, such as to LastNonEmpty. Similar to Multidimensional, this will avoid the need for user-defined explicit measures.


