Posts

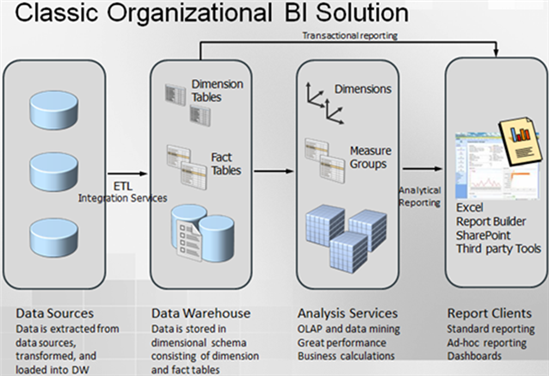
Is SharePoint Overkill for BI?

As you know, Microsoft BI is tightly interwoven with Excel on the desktop and SharePoint on the server. Most complaints about SharePoint fall in two categories:

  • Complexity – SharePoint is like the ocean. The further you go, the deeper it gets. Troubleshooting is no fun. You know it and I know it.
  • Cost – Most BI features require SharePoint Server Enterprise. Besides the product cost, each user requires a client access (CAL) license (about $100 per user). With larger companies, cost quickly adds up when you roll BI to the masses. You can use the Microsoft License Advisor to estimate your investment but be sure to include additional cost for Windows and SQL servers.

So, is SharePoint overkill for BI? My answer is it depends. Let’s take a look at the graph that shows the correlation between the organization size and SharePoint features.


012414_0229_IsSharePoin1

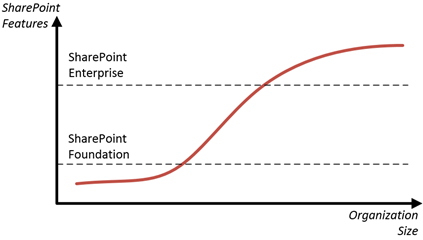
A small organization might not need SharePoint at all. It’s likely that all BI needs of such a company will be met by SQL Server and Excel. As the company size increases, however, SharePoint might look attractive for what’s designed for. This company might decide to adopt SharePoint Foundation (freely available) for document storage and collaboration. Unfortunately, out of all Microsoft BI tools, only Reporting Services works on SharePoint Foundation (except Power View and Alerts), as explained in Microsoft Books Online.

Supported FeaturesMinimum SharePoint Edition Required
General Reporting Services report viewing and feature integration with SharePointSharePoint Foundation
Power View and AlertsSharePoint Server Enterprise

As the company continues to grow, its appetite for more BI features increases. This is the middle zone in the S curve. At this point, the company might be interested in team BI, including Power View and Power Pivot for SharePoint. At the same time, the company might not be interested in the SharePoint enterprise features but it’s out of luck. The BI features require SharePoint Enterprise. This is where it could be useful if Microsoft introduces a SharePoint BI Edition with a more attractive pricing model, such as an edition that has all BI features, doesn’t have the rest of the SharePoint enterprise features and it doesn’t require CAL licensing. SharePoint Online can mitigate some of the cost concerns but as it stands it’s limited to self-service BI (Power Pivot and Power View) only.

Moving to the upper mid-size and enterprise sector, you’re likely to be interested in more and more SharePoint enterprise features. For example, we’re currently working on a set of best practice documents for a Fortune 50 organization that’s rolling out Microsoft BI across the enterprise. They’re interested in data governance, taxonomy, retention, content approval, manageability, security, scalability, risk management, auditing, and others. You’ll be hard pressed to find such features in popular third-party BI offerings. And, one great thing about SharePoint is that it doesn’t discriminate among documents. As far as it’s concerned, a BI artifact, such as an SSRS report or Excel workbook, is just a document…all features just work. So, SharePoint Enterprise might be an attractive platform for larger companies although its CAL licensing might be difficult to swallow.

This table shows an expanded list of the Microsoft BI features but, as I mentioned, no further investigation is necessary. All BI features except general SSRS reporting requires SharePoint Enterprise.

Teo’s Best and Worst of Microsoft BI in 2013

In the spirit of the last day of 2013, I’m sipping eggnog and contemplating on BI in 2013.

BEST

  1. Microsoft leads the Gartner’s 2013 Business Intelligence Magic Quadrant.
  2. Microsoft leads the Gartner’s 2013 Data Warehouse Magic Quadrant.
  3. Power View connectivity to Multidimensional (DAXMD) released in CU4 of SQL Server 2012 SP1.
  4. SQL Server 2012 Parallel Data Warehouse appliance released with Hadoop support at very attractive pricing.
  5. Microsoft is the first vendor to offer natural queries (unfortunately only in the cloud at this point).

WORST

  1. Microsoft not doing enough to compete effectively on the presentation/visualization front against third party vendors. I’ll throw poor mobile support into this bucket too.
  2. Slow pace of BI enhancements across product groups. Example: Excel’s still lacking Power View support for Multidimensional (DAXMD was released in May).
  3. Microsoft pushing cloud BI and deciding to prioritize cloud enhancements, such as natural query, over on premises.
  4. Microsoft’s ongoing preoccupation with Tabular (it’s difficult to find a good case for it as it’s caught now in the middle between columnstore indexes and Multidimensional) and self-service BI (focus should be 80% on organizational BI and 20% on personal).
  5. Still no metadata lineage and change impact. What happened to Project Barcelona?

Happy New Year!

Windows Azure Infrastructure Services

Microsoft announced today the availability of Windows Azure Infrastructure Services which is a collective name for running Virtual Machines and Virtual Networks in the cloud. Scott Guthrie’s blog on this subject is very informative. Pricing get slashed too to be competitive with Amazon. What’s interesting is that these cloud VMs can be configured as an extension to your existing network. In the BI world, this would allow us to source data from existing on-premises data sources albeit probably over a much slower connection, such as to host your ETL, data mart and SSAS in the cloud or just the analytical layer. Speaking of connection speeds, the Azure bandwidth is actually good (5-15 GB/s) although it’s likely that is likely you’ll hit a bottleneck with your ISP on your way to and back from the cloud.

And, speaking of BI, check the SQL Server Business Intelligence in Windows Azure Virtual Machines document if you’re interested in cloud BI deployments. Notice that there are VM templates that install SSRS (native mode), SSAS (Multidimensional), as well as SharePoint 2013 but you can install manually the other components as well if you need to, such as Tabular. Microsoft recommends Extra Large VM size for BI deployments although its memory capacity (14 GB) might be on the lower end especially for Tabular.

About Tableau 8

Jen Underwood highly recommended I attend the Tableau 8 tour on Tuesday to witness firsthand its new features. Naturally, I couldn’t resist of comparing everything I saw with Microsoft BI. I took some time after the pretention to take 8.0 for a spin and reconfirm my understanding. Here are the top five things I liked about Tableau.

  1. Simplicity – A few months ago, I blogged about my top 5 Microsoft BI wish list. My number 1 wish was a continued focus on integration and simplification. Tableau 8.0 nailed it down as far as simplicity, at least on the visualization side of things. One desktop tool and its server-based counterpart. A tool whose sole purpose is BI. Not something that was bolted on another tool as a BI add-on. No layers to integrate with and configure on the server side, and error logs to sieve through.
  2. Visualization – Visualizations are yet simple and powerful. The presenter was quick to point out the areas where the tool excels in comparison with Power View. Tree maps and bubble maps were all over the place, as well as the ability to customize them, e.g. change the color of a pie slice. I liked the ability to dynamically group items (similar to custom MDX sets in Excel). For example, the presenter lassoed a bunch of cities in North America and created a North America dynamic group that was subsequently used to analyze sales. Another interesting in-the-box feature is ability to forecast data. In the Microsoft world, this would require some flavor of data mining (not a native feature in both Excel and Power View).
  3. Mobility – This is one area where Tableau has at least a year lead over Microsoft BI (see my number 2 wish item in the above blog). Once the dashboard is published to the server, it can be viewed and edited on mobile devices (iPad was demonstrated). By contrast, due to its Silverlight nature, Power View is currently supported only in Internet Explorer. However, as we’ve heard at conferences, Microsoft is hard at work to change this.
  4. JavaScript API – Developers creating web applications can integrate and embed interactive Tableau content into their applications via the new JavaScript API.
  5. Data reach – Apparently, Tableau customers are asking for specialized connectors to cloud data and emerging data sources. Version 8.0 introduces connectors for Salesforce.com, Google Analytics, Hadoop, SAP Hana, etc.

Being a self-service BI tool, in my opinion the backend is where Tableau trails behind Microsoft BI, including:

  1. No continuum for self-service to organizational BI – While you can publish a workbook to the server, you can’t upgrade the workbook to an organizational BI model. Nor can you connect to a published workbook as a data source, e.g. by using Excel as a front end.
  2. In-memory engine – Based on my experiments, xVelocity (the in-memory engine of PowerPivot and Tabular) excels the Tableau in-memory technology both in compression and speed.
  3. Programming – Tableau supports custom calculations but the potential is not even close to what you can do with DAX. For example, I couldn’t find a way to use many-to-many relationship (not natively supported in Power Pivot but can be handled with DAX formulas).
  4. Scalability – I haven’t tested the server edition yet but I would expect Analysis Services to scale much better than Tableau due to the desktop origin of the latter.
  5. Security – Tableau supports action-level security, e.g. allowing the user to edit workbooks, and basic user filters that allow user access to specific members, such as Bob can see only USA. There is no dynamic data security.
  6. Usability – Besides the presentation layer where Tableau excels, I’ve noticed areas that would be surprisingly difficult for a self-service BI tool. For example, there isn’t option to visualize tables and relationships in a diagram view. For some obscure reason (I guess so it knows what to aggregate and not), Tableau insists on separating entities as dimensions and measures. Tableau stores data and connection definition as external files, and maintains connections per entity. For example, I couldn’t find a way to import more tables using the same connection definition.

In summary, choosing between Tableau and PowerPivot for self-service BI would require careful examination of requirements and comparing pros and cons of the two. On the corporate BI side of things, you should definitely consider Tableau as a front end to Analysis Services if you need an alternative to Microsoft Excel and/or Power View.

When Developers and BI Collide

I’ve been running in this situation quite often so I thought this will make a good topic for a blog.

Scenario: Management has asked for some sort of a BI solution, such as a dashboard. BI hasn’t happened to the organization in question yet. But they have smart developers and there is no project that they can’t do. As the story goes, developers go to work and whip out some code… lots of it. Code for doing ETL, code for the database layer, and code for implementing the presentation layer, such as as a custom web application with cool third-party widgets. Everyone is happy… at least for a while.

I don’t have an issue with developers. In fact, I spent most of my career writing code. However, there are several pitfalls with this approach so let’s mention some of them:

  1. Custom code is expensive to write and maintain – Developers are pulled away from their primary tasks to implement the BI solution. When the initial enthusiasm wears off, managers find it difficult to allocate developers to extending and maintaining the BI solution.
  2. You end up with a proprietary, tightly-coupled solution – The solution would probably meet the initial goals but it might be difficult to extend. What if the custom web application is not enough and users prefer to analyze data in another tool, such as Microsoft Excel? Where are business calculations defined? How do you handle security?
  3. Not the right tools – There are many scenarios when writing custom code makes sense but BI is not one of it. There are specialized tools that are geared specifically toward BI. If you write custom code, more than likely you’ll face performance and maintenance challenges in a long run.
  4. Not a best practice – Most projects start simply but grow in complexity over time. It’s not uncommon for management to ask for more features, such as analyzing data by other subject areas or drilling to details. What’s has started as a dashboard project might evolve to an end-to-end BI solution that requires a data warehouse, analytical layer, and different presentation options.
  5. Coders are not BI pros – I hate to say this but even the smartest programmers don’t know much or care about BI. More than likely, you’ll end with a normalized database and summary tables for improving performance with aggregates. Again, there tools and methodologies for BI so there is no point reinventing the wheel. If you don’t know better, hire someone who does. “When all you have is a hammer everything looks like a nail” paradigm won’t bring you too far.

Solution: I’m sure you can add to the list, but what’s the solution? When you hear about BI or its manifestations, such as dashboards, reporting, analytics, etc., the following architecture should immediately come to mind.

3806.biarch.png-550x0

This architecture is somewhat simplified. For example, it doesn’t show a staging database but it has the main pieces and their corresponding technologies in the Microsoft BI platform:

  1. A data warehouse whose schema is designed with reporting in mind.
  2. Integration services packages for ETL processes. They still have to be maintained but I dare to declare that maintaining SSIS is much easier that maintaining custom code. For example, it doesn’t require coding skills, it scales well, and it has a comprehensive logging infrastructure.
  3. An analytical layer, either as a multi-dimensional cube or a tabular model. This is the most overlooked piece but it’s the most important for the reasons I explained in my “Why an Analytical Layer?” blog.
  4. Finally, just like a car manufacturer, you should strive to assemble your solution with prefabricated parts instead of writing custom code. For example, you can implement very compelling dashboards with Power View that uses your analytical layer as a data source without having to write a single line of code. Not to mention that you can delegate this task to business users.

Now, with custom code you can do anything, including features that you can’t get out of the box with prepackaged BI tools. However, you’ll be surprised how willing your management might be to compromise with features especially in this economy.

Geocoding with Power View Maps

As I wrote before, Power View in Excel 2013 and SharePoint with SQL Server 2012 SP1 supports mapping. The map region supports geocoding and it allows you to plot addresses, countries, states, etc, or pairs of latitude-longitude coordinates. The key for getting this to work is to mark the columns with appropriate categories.

  1. Using latitude-longitude

If you have a SQL Server table with a Geography data type, you can extract the latitude and longitude as separate columns.

SELECT SpatialLocation.Lat, SpatialLocation.Long FROM Person.Address

Once you import the dataset in PowerPivot, make sure to categorize the columns using the Advanced tab.

112912_1308_Geocodingwi1

The map region doesn’t support grouping on latitude-longitude so you can’t just place them in the Latitude-Longitude zones and expect it work. Instead, you have to add another field, such as address or both the Latitude-Longitude combination to the Location field. The map groups on the Location zone but uses the Latitude and Longitude to place the points.

112912_1308_Geocodingwi2


  1. Address geocoding


    If you don’t have Latitude-Longitude, the map is capable of geocoding full addresses. Again, the trick here is to categorize the FullAddress column as Address. However, if you have invalid addresses, you’ll find that the map won’t show them. Instead, categorize the column as Place, which you can find in the More Categories section (thanks to Sean Boon from the Reporting Services team for the tip).


    112912_1308_Geocodingwi3


    The map passes to Bing the fact that the field is mapped as Address so it should plot whatever we get back from Bing. The Bing Maps web experience isn’t identical to the API as you can’t pass the Address hint to Bing in the web experience. The Place category is more liberal in terms of what it will attempt to plot.


    112912_1308_Geocodingwi4

Making Big Data Real from TAG BI

TAG BI is organizing a “Making Big Data Real” event on August 23th and I was honored to be one of the panelists. Please join us if you can and ask me the techniques we use to implement multi-terabyte data warehouses on symmetric multiprocessing (SMP) systems that deliver reports within milliseconds and maximize your return on investment.

“The Technology Association of Georgia’s Business Intelligence/Enterprise Performance Management society explores one of the hottest topics in the technology landscape, Big Data. You have likely read the articles and the books and now you need to know more. On August 23, we will bring together a panel of experts for a most important session: “Making Big Data Real”. Please join us as we engage corporate technology leaders and consultants that are on the cutting edge of this new technology landscape. We will tell you what Big Data is all about and how you can make it real and actionable at your workplace and in your career. This is surely a professional event you do not want to miss.”

What’s New in Office 2013 BI: Part 4 – New Features in Excel Web Reports

To demonstrate the new features with Excel web reports, I stood up an Office 365 Technical Preview site. If you have received Office 365 invitations already, make sure that you choose the one with the SKU E3. Otherwise, you’ll get access to the administrator portal only and you won’t see the SharePoint, Outlook, and other menus.

Assuming you use Office 2013, you’ll find that it integrated much better with the cloud. Gone is the Save and Send menu. Instead, saving to could destinations, such as SkyDrive and Office 365, can be now be initiated from the Save As menu by adding a new place.

080612_1336_WhatsNewinO1

As before, once the Excel workbook lands in the Office 365 SharePoint (or SharePoint 2013) land, it’s automatically available for web reporting. However, the most exciting new feature now is that the web reports are editable and end users can change the report layout with both PowerPivot and OLAP cubes as data sources! To do so, simply right-click any cell on the pivot report and click Show Field List. Just like the desktop version of Excel, you can now add or remove fields in the Field List to update the report.


The Quick Explore feature is available as well to support a “Proclarity-like” data exploration experience. You can click a cell on the report and then click on the magnifying class icon and pops up. Or, right-click a cell and click Quick Explore. Then, expand a table (dimension) and select which field (attribute) you want to drill-down to.

080612_1336_WhatsNewinO3

Unfortunately, drillthrough is still unsupported and you can’t drill down a cell to see the underlying details as you can in Excel desktop. This feature is very frequently requested and I don’t know why it didn’t make the cut. Another feature that I would love to get with both Excel desktop and web reports is the Decomposition Tree that is currently only available with PerformancePoint Services. Speaking of PerformancePoint, SharePoint 2013 brings improved branding, filter enhancements and filter search, as well as support for Analysis Services EffectiveUser connecting string setting in case configuring Kerberos is not an option.

What’s New in Office 2013 BI: Part 3 – Improved Productivity

Excel 2013 includes features that improve productivity. Here are the ones related to BI.

Flash Fill

Suppose that you have a list of customers with addresses. When analyzing the data, you might want to analyze sales by USA states but the data doesn’t include a state column. Instead, suppose you have an address column that includes the mailing address, state, and zip code. So, you decide to create a new column. Now, instead of using a formula to parse the address as you would do in the past, you just enter WA in the first row. When you start typing CA in the second row, Excel figures the pattern and suggests to flash-fill the column. Notice that Flash Fill doesn’t use Excel formulas and you won’t get formulas in the column. Excel handles flash fill natively.

073012_0145_WhatsNewinO1

Quick Explore

This feature was included to allow you to quickly generate charts for analyzing data by time with Multidimensional and Tabular models. When you click a cell in a pivot report, the Quick Explore button is shown that gives you options to create trend or cycle chart. Notice that you can select another date dimension (table) to replace the default selection of Date.Calendar Date.

Note Excel 2013 charts don’t require supporting sheets with pivot reports anymore.

073012_0145_WhatsNewinO2

Speaking about analysis by time, Excel adds a new fitter, called “timeline”, that is specifically designed for this purpose. I found it an improved version of the Power View filter for integer fields. You can click a section in the timeline to select a specific period. Or, you can drag the mouse for an extended selection, such as years 2005-2007.

073012_0145_WhatsNewinO3

Quick Analysis

Suppose you have an Excel table but you don’t know much about pivot table, charts, and formatting. You can simply select the list (Ctrl+A) and click the Quick Analysis button to open a window that examines the dataset and suggests formatting (data bars, color scales, and conditional formatting, charts, tables, and sparklines.

073012_0145_WhatsNewinO4

Office 2013 Business Intelligence Highlights

Jen Underwood wrote a great summary about what’s new in Office 13 BI. Interestingly, you’ll be able to drill down to lower location in the Power View maps, e.g. from country to state and then to lowest level you placed in the location zone when configuring the map visualization.