Posts

Atlanta MS BI and Power BI Group Meeting on April 6th

MS BI fans, the time has come for a virtual meeting. Please join us online for the next Atlanta MS BI and Power BI Group meeting on Monday, April 6th, at 6:30 PM. I’ll show you how business analysts can apply AutoML in Power BI Premium to create predictive models. For more details, visit our group page and don’t forget to RSVP (fill in the RSVP survey if you’re planning to attend).

Presentation:Bringing Predictive Analytics to the Business User with Power BI AutoML (Virtual Meeting)
Date:April 6th, 2020
Time6:30 – 8:30 PM ET
Place:Join Microsoft Teams Meeting

Learn more about Teams | Meeting options

Computer audio is recommended

Conference bridge number 1 605 475 4300, Access Code: 208547

Overview:With the growing demand for predictive analytics, Automated Machine Learning (AutoML) aims to simplify this process and democratize Machine Learning so business users can create their own basic predictive models. Join this presentation to learn how to apply AutoML in Power BI Premium to predict the customer probability to purchase a product. I’ll show you the end-to-end AutoML process, including:

·       Create a dataflow

·       Choose a field to predict

·       Choose a model type

·       Select input variables (features)

·       Train the model

·       Apply the model to new data

·       Bonus: Integrate Power BI with AzureML

Speaker:Through his Atlanta-based company Prologika (https://prologika.com), a Microsoft Gold Partner in Data Analytics, Teo Lachev helps organizations make sense of their most valuable asset: their data. His strategy formulation, trusted advisory and mentoring, design and implementation services empower clients to apply effectively data analytics in order to understand, improve, and transform their business processes. Teo has authored and co-authored several books on organizational and self-service data analytics, and he has been leading the Atlanta Microsoft BI and Power BI group since he founded it in 2010. Teo has been a Microsoft Most Valued Professional (MVP) Data Platform since 2004.
Prototypes without pizza:Power BI latest features

PowerBILogo

NullToZero in Power BI and Tabular

Null and zero typically have different semantics, where null indicates an unknown or missing value while zero is an explicit value. Sometimes, however, you want to show nulls as zeros. For example, an insurance company might want to show 0 claims instead of a blank value. By default, when a DAX filter doesn’t find any rows, the formula returns null (BLANK in DAX). For example, this Claims Count measure will return null when no claims match the report filters.

Claims Count = DISTINCTCOUNT(FactClaims[UniqueClaimNumber])

How do we show nulls as zeros?

The easiest and fastest way is to simply append zero.

Claims Count = DISTINCTCOUNT(FactClaims[UniqueClaimNumber]) + 0

Note that the storage engine is optimized to eliminate empty spaces so converting measures to zero can impact performance negatively. In addition, by default, reports remove dimension members with empty measures. This won’t happen if measures return zero.

Atlanta MS BI and Power BI Group Meeting on February 3rd

MS BI fans, join us for the next Atlanta MS BI and Power BI Group meeting on February 3rd, Mondayat 6:30 PM at the Microsoft office in Alpharetta. Shabnan Watson will discuss how to apply aggregations to Power BI DirectQuery datasets to improve report performance.  Melissa will sponsor the meeting. For more details, visit our group page and don’t forget to RSVP (fill in the RSVP survey if you’re planning to attend).

Presentation:Aggregations in Power BI
Date:February 3rd, 2020
Time6:30 – 8:30 PM ET
Place:Microsoft Office (Alpharetta)
8000 Avalon Boulevard Suite 900
Alpharetta, GA 30009
Overview:Aggregations are one of the most important optimization methods for managing big datasets in Power BI. Combined with Direct Query storage mode, they allow big datasets to be analyzed efficiently by answering high level analytical queries quickly from memory while sending more detailed queries back to the source database. In this session, you will learn about the concept of aggregations, different table storage modes in Power BI, different kinds of aggregation tables, how to configure aggregation tables so that they can answer high level user queries, and finally how to use tools such as DAX Studio or Extended Events to determine if the aggregations are actually being used.
Speaker:Shabnam Watson is a Business Intelligence consultant with 18 years of experience developing data warehouse and BI solutions. Her work focus within the Microsoft BI Stack has been on Analysis Services and Power BI. She is an active member of PASS community and has spoken at PASS Summit, PASS SQL Saturdays, PASS Women In Technology Virtual Chapter, and other Local user groups. She is one of the organizers of SQL Saturday Atlanta and SQL Saturday Atlanta BI Edition. She holds a master’s degree in computer science, a bachelor’s degree in Computer Engineering, and a Certified Business Intelligence Professional (CBIP) certification by The Data Warehouse Institute (TDWI).
Sponsor:Bad data is bad business. Melissa helps organizations profile, cleanse and verify, dedupe and enrich all their people data (name, address, email and phone number) and more.  With clean, accurate and up-to-date customer information, organizations can monetize Big Data, improve sales and marketing, reduce costs and drive business insight. https://www.melissa.com/
Prototypes with PizzaTBD

PowerBILogo

Atlanta MS BI and Power BI Group Meeting on January 6th

MS BI fans, join us for the next Atlanta MS BI and Power BI Group meeting on January 6th, Mondayat 6:30 PM at the Microsoft office in Alpharetta. I’ll introduce to Power BI Premium Automated Machine Learning (AutoML). Prologika will sponsor the meeting. For more details, visit our group page and don’t forget to RSVP (fill in the RSVP survey if you’re planning to attend).

Presentation:Power BI Automated Machine Learning (AutoML)
Date:January 6th, 2020
Time6:30 – 8:30 PM ET
Place:Microsoft Office (Alpharetta)
8000 Avalon Boulevard Suite 900
Alpharetta, GA 30009
Overview:With the growing demand for predictive analytics, Automated Machine Learning (AutoML) aims to simplify this process and democratize Machine Learning so business users can create their own basic predictive models. Join this presentation to learn how to apply AutoML in Power BI Premium to predict the customer probability to purchase a product. I’ll show you the end-to-end AutoML process, including:

·       Create a dataflow

·       Choose a field to predict

·       Choose a model type

·       Select input variables (features)

·       Train the model

·       Apply the model to new data

·       Bonus: Integrate Power BI with AzureML

Speaker:Through his Atlanta-based company Prologika (https://prologika.com), a Microsoft Gold Partner in Data Analytics, Teo Lachev helps organizations make sense of their most valuable asset: their data. His strategy formulation, trusted advisory and mentoring, design and implementation services empower clients to apply effectively data analytics in order to understand, improve, and transform their business processes. Teo has authored and co-authored several books on organizational and self-service data analytics, and he has been leading the Atlanta Microsoft BI and Power BI group since he founded it in 2010. Teo has been a Microsoft Most Valued Professional (MVP) Data Platform since 2004.
Sponsor:Prologika is one of the most trusted names in Data Analytics. Our clients, from small businesses to Fortune 100 enterprises, derive tremendous value from our services. Our mission is to help organizations make sense of data by applying the latest technologies for descriptive and predictive analytics and get actionable insights. Your organization will spend less time mining for information and be better equipped to make sound business decisions. https://prologika.com

PowerBILogo

Atlanta MS BI and Power BI Group Meeting on December 2nd

MS BI fans, join us for the next Atlanta MS BI and Power BI Group meeting on November 4, Mondayat 6:30 PM at the Microsoft office in Alpharetta. Stacey Jones will present Power BI options with Python. Accelebrate will sponsor the meeting. And I will share some tips demoing the latest Power BI Desktop features, such as the new ribbon, decomposition tree and AI integration. For more details, visit our group page and don’t forget to RSVP (fill in the RSVP survey if you’re planning to attend).

Presentation:Integrating Power BI with Python
Date:December 2nd, 2019
Time6:30 – 8:30 PM ET
Place:Microsoft Office (Alpharetta)
8000 Avalon Boulevard Suite 900
Alpharetta, GA 30009
Overview:Python is well suited for Data Science and big data professionals. It has been voted as the most popular programming language in 2019. Microsoft made big investments in open-source R and Python, especially to extend Power BI. Join this session to learn how you can integrate Python with Power BI. Learn how to use Python in these ways:

·       Use Python as a data source

·       Transform data

·       Produce beautiful visualizations

Speaker:Stacey Jones specializes in mentoring and guiding firms in their efforts to build a modern Data, AI & BI governance programs that empower their business with Self-Service BI and Data Science capabilities. He currently serves as the Principal Data Solutions Architect at the Atlanta Microsoft Technology Center (MTC).
Sponsor:Don’t settle for “one size fits all” training. Choose Accelebrate, and receive hands-on, engaging training precisely tailored to your goals and audience! Our on-site training offerings range from ASP.NET training and SharePoint training to courses on ColdFusion, Java™, C#, VB.NET, SQL Server, and more. Accelebrate.com
Prototypes with Pizza“New ribbon, decomposition tree, and AI integration in Power BI Desktop” by Teo Lachev

PowerBILogo

Atlanta MS BI and Power BI Group Meeting on November 4th

MS BI fans, join us for the next Atlanta MS BI and Power BI Group meeting on November 4, Mondayat 6:30 PM at the Microsoft office in Alpharetta. Andy Lawrence will share best practices for impactful Power BI Dashboards. CCG Analytics will sponsor the meeting. For more details, visit our group page and don’t forget to RSVP (fill in the RSVP survey if you’re planning to attend).

Presentation:Best Practices for Impactful Power BI Dashboards
Date:November 4, 2019
Time6:30 – 8:30 PM ET
Place:Microsoft Office (Alpharetta)
8000 Avalon Boulevard Suite 900
Alpharetta, GA 30009
Overview:Power BI is gaining momentum as a preferred tool for dashboards and interactive reports. Let’s revisit some best practices for dashboard development, such as:

·       The importance of form and function

·       Facilitating user adoption

·       Mistakes that everyone makes

·       Fast shortcuts for clean reports

·       Hidden settings that are lifesavers

·       Best Power BI updates of 2019

·       Live demo of a fast dashboard build

·       Questions

Speaker:Andy Lawrence is a senior Power BI consultant at CCG Analytics and the leader of the Tampa Power BI user group. He’s a Florida native and a proud UF Gator (MBA) and USF Bull (MIS). At CCG he provides guidance on data modeling, tabular environments, azure administration, DAX writing, T-SQL and data visualization best practices. All of which he can expand upon if you have questions during his presentation.
Sponsor:CCG specializes in deploying solutions that not only provide value to the business but are adopted by users ensuring accountability of the IT driven system.  Moving beyond reporting, our Business Intelligence solutions support data governance, quality and standardization across the organization and enable stakeholders with tools like predictive analytics, user-defined alerts, data mining, what-if analysis and visually appealing dashboards.
Prototypes with Pizza“Lineage view” by Teo Lachev

PowerBILogo

Filtering Power BI Visuals by Measure

Power BI lets you filter the visual data by a measure, such as by a measure that dynamically calculates the customer’s rank. This is convenient but there are performance implications related to the way Power BI autogenerates the DAX query. If a visual has a visual-level filter on a measure, Power BI Desktop defines a variable table filter that includes all measures in the visual. In the following example, the visual filters on the IncludedInRank measure, but the filter table includes all measures in the visual:

VAR __ValueFilterDM1 =
FILTER (
KEEPFILTERS (
SUMMARIZECOLUMNS (
‘Customer'[PARENT_NAME],
‘Customer'[Label_DM],
‘Customer'[VP_NAME],
__DS0FilterTable,
__DS0FilterTable2,
__DS0FilterTable3,
__DS0FilterTable4,
“Vol_Gr_WKND”, ‘NRT_PRR_Parent'[Vol_Gr_WKND],
“Vol_Gr_WE_Mon”, ‘NRT_PRR_Parent'[Vol_Gr_WE-Mon],
“Vol_Gr_WE_Tue”, ‘NRT_PRR_Parent'[Vol_Gr_WE-Tue],
“Vol_Gr_WE_Wed”, ‘NRT_PRR_Parent'[Vol_Gr_WE-Wed],
“Vol_Gr_WE_Thu”, ‘NRT_PRR_Parent'[Vol_Gr_WE-Thu],
“Vol_Gr_WE_Fri”, ‘NRT_PRR_Parent'[Vol_Gr_WE-Fri],
“WTD_Gr_ptc”, ‘NRT_PRR_Parent'[WTD_Gr_ptc],
“IncludedInRank”, IGNORE ( ‘NRT_PRR_Parent'[IncludedInRank] )
)
),
[IncludedInRank] = 1
)

As a result, these measures are evaluated twice: once in the filter table and twice in the main query (EVALUATE clause). This could definitely impact performance if the measures are slow to begin with. While waiting on Microsoft to provide more control over the autogenerated query, one approach to mitigate the performance impact is to use the Power BI-provided TOPN filter. In this example, instead of sorting and filtering on IncludedInRank to find the top N customers, you would apply a TOPN filter on Customer[Parent Name] based on the IncludedInRank measure. When TOPN is used, the autogenerated filter table will filter only on the measure used for TOPN, thus avoiding evaluating the rest of the measures.

Atlanta MS BI and Power BI Group Meeting on October 7th

MS BI fans, join us for the next Atlanta MS BI and Power BI Group meeting on October 7, Mondayat 6:30 PM at the Microsoft office in Alpharetta. Qubole will show us how Presto, Azure Data Lake, and Power BI can be used to analyze Big Data. Qubole will sponsor the meeting. For more details, visit our group page and don’t forget to RSVP (fill in the RSVP survey if you’re planning to attend).

Presentation:Leveraging Power BI on Presto for the Azure Data Lake
Date:October 7, 2019
Time6:30 – 8:30 PM ET
Place:Microsoft Office (Alpharetta)
8000 Avalon Boulevard Suite 900
Alpharetta, GA 30009
Overview:Presto is a distributed ANSI SQL engine designed for running interactive analytics queries. Presto outshines other data processing engines when used for business intelligence (BI) or data discovery because of its ability to join terabytes of unstructured and structured data in seconds, or cache queries intermittently for a rapid response upon later runs. Presto can also be used in place of other well-known interactive open-source query engine such as Impala, Hive or traditional SQL data warehouses. Attend this event to learn:

·        Why Presto is better suited for ad-hoc queries than other engines like Apache Spark

·        How to jumpstart analysts across your organization to harness the power of your big data

·        How to generate interactive or ad hoc queries or scheduled reports using Presto

·        Real-world examples of companies using Presto

Speaker:Man Zhang is a Solutions Architect at Qubole. He has 20+ years in software systems architecture, development, and integration and 4+ years in Big Data architecture. https://www.linkedin.com/in/man-zhang-34a887/
Sponsor:Qubole delivers a Self-Service Platform for Big Data Analytics built on Amazon Web Services, Microsoft and Google Clouds. We were started by the team that built and ran Facebook’s Data Service when they founded and authored Apache Hive.  With Qubole, a data scientist can now spin up hundreds of clusters on their public cloud of choice and begin creating ad hoc and/or batch queries in under five minutes and have the system autoscale to the optimal compute levels as needed.  Please feel free to test Qubole Data Services for yourself by clicking “Free Trial”​ on the website.
Prototypes with PizzaTBD

DCI_PowerBI

Atlanta MS BI and Power BI Group Meeting on September 10th

MS BI fans, join us for the next Atlanta MS BI and Power BI Group meeting on September 10, Tuesday, at 6:30 PM at the Microsoft office in Alpharetta. This is a meeting not to miss. A DAX founder, Jeffrey Wang (Principal Software Engineer Manager at the Power BI product group) is coming all the way from Seattle to share DAX best practices with our group! Captech Consulting will sponsor the event. For more details, visit our group page and don’t forget to RSVP (fill in the RSVP survey if you’re planning to attend).

Presentation:Common DAX Patterns
Date:September 10, 2019
Time6:30 – 8:30 PM ET
Place:Microsoft Office (Alpharetta)

8000 Avalon Boulevard Suite 900

Alpharetta, GA 30009

Overview:We will learn common DAX patterns by examining several issues frequently reported by DAX users through PowerBI customer support tickets. Users will be able to:

1.      Learn from mistakes made by other DAX users so you can avoid them in your own work.

2.      Learn the common techniques to debug DAX problems.

3.      Learn the best DAX patterns to solve common problems.

4.      Gain deeper understanding of DAX by learning relevant history and underlying design of the programming language.

5.      Ask me their own DAX questions

Speaker:Currently working as Principal Software Engineer Manager at Microsoft, Jeffrey Wang stumbled upon BI after the Y2K bubble burst, fell in love with the field, and stayed in the industry ever since. After I joined Microsoft Analysis Services engine team in 2004, I quickly discovered that working on the programming language is the best way to stay close to the end users, so I joined the MDX formula engine team. After shipping a couple of releases of SQL Server Analysis Services, I joined the committee that created DAX. Today I lead the development effort of the DAX engine and the modeling engine inside the Power BI product group.

DCI_PowerBI

Implementing Asymmetric Crosstab in Power BI

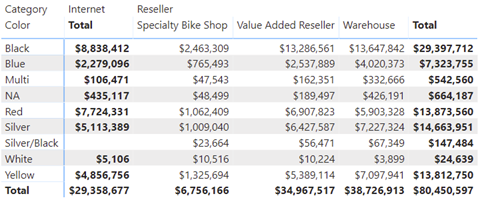
A recent requirement called for an asymmetric crosstab report in Power BI. Transitioned to Adventure Works, the final report looks like this.

The Internet column shows the sales amount from FactInternetSales. Then, the matrix pivots on the BusinessType column in the FactResellerSales. Because, Internet sales don’t relate to BusinessType, it doesn’t make sense to pivot it. Instead, we want to show Internet sales in a single static column before the crosstab portion starts.

Implementing such a report in SSRS is easy thanks to its support of adjacent groups and static columns but not so much in Power BI. The issue is that Matrix would happily pivot both measures and the InternetSalesAmount would be repeated for each business type.

Fortunately, with some blackbelt modeling and DAX, we can achieve the desired effect. I attached the pbix file and here are the high-level implementation steps:

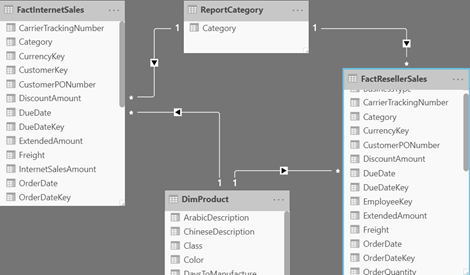
  1. Add a ReportCategory table (you can use the Enter Data feature), with a single column Category and two values: Internet and Reseller. Add a Category calculated column to FactInternetSales with a value of “Internet”. Add a Category calculated column to FactResellerSales with a value of “Reseller”. Create relationships FactInternetSales[Category]->ReportCategory and FactResellerSales[Category]->ReportCategory. These relationships are required because Matrix doesn’t support unrelated tables. Your model schema should look like this:

  2. Create a SalesAmount measure with the following formula:
     SalesAmount = IF(SELECTEDVALUE('ReportCategory'[Category]) = "Internet" && NOT ISINSCOPE('FactResellerSales'[BusinessType]),
     SUM(FactInternetSales[InternetSalesAmount]),
     SUM(FactResellerSales[ResellerSalesAmount]))

    The IF condition checks if the measure is under the Internet category. NOT ISINSCOPE(‘FactResellerSales'[BusinessType]) will return TRUE only for the total column in the Internet section. Otherwise, it will return the reseller sales. Because there are no reseller sales in the Internet category, only Internet sales will be shown. Note that SELECTEDVALUE will return FALSE for empty cells which is why I had to create the ReportCategory table.

  3. Add Matrix viz and bind Product[Color] to rows, ReportCategory[Category] and ResellerSales[BusinessType] on columns, and SalesAmount in Values. Expand the columns to the next level (to show the BusinessType level).
  4. In the Matrix format properties, go Subtotals, enable the “Per column” setting, and turn off the Category subtotal to avoid showing the reseller sales total twice.

Although Power BI has made great progress on the visualization side of things, it still lacks in flexibility. The two features that miss the most from SSRS are nesting visuals (to create repeat sections) and the flexible Matrix layout. However, with some black belt modeling and DAX, workarounds are possible.