Posts

Excel Connected Tables: Another Opportunity Missed

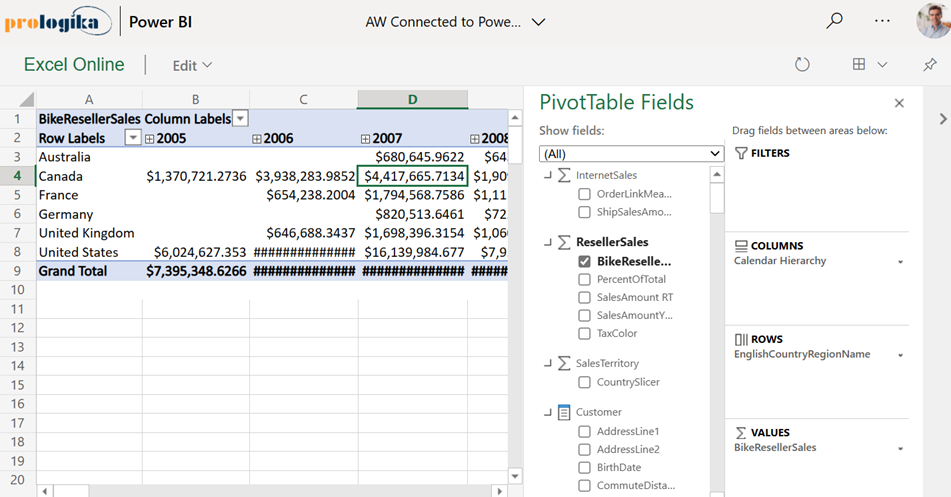
For years users have been asking for Excel tables (not pivots) connected to SSAS so they can simply browse the data in a tabular format not subjected to the shortcomings of pivots. And for years Excel has been supporting just pivots that natively understand only SSAS OLAP cubes. Is Power BI changing things? Somewhat. Enter refined Excel connected tables. They look great on the surface. You go through a wizard that lets you select and filter your data and you get an Excel table connected to a Power BI dataset. Awesome, right?

Unfortunately, what’s missing is the Field List. To make the feature useful, the user should be able to access the Field List and remove, add, filter, as they can do with pivots. However, once the table is generated, to change it you either must go through the wizard again or change the DAX query (right-click the table, click Table, and then Edit Query). Down the DAX rabbit hole we go again…

As they stand, Excel connected tables are not an interactive browsing tool. Instead, they are geared towards making Power BI datasets accessible in Excel.

Since I lost hope that Excel will discover Tabular and DAX one day, I hope the community will step in to fill in the gap by providing UI like the Pivot Field List so that the user doesn’t need to mess with DAX when all that’s needed is an Excel connected table for ad-hoc data exploration.

Interactive Excel Pivots in Power BI

A long-standing limitation of Power BI has been that Excel pivot reports connected to external Analysis Services models can’t be interacted with when uploaded to Power BI Service. You get the cached pivot report but any attempt to interact with the report online (that is in Excel Online), such as to change a slicer or filter, would result in an error complaining that the connection can’t be refreshed and there hasn’t been a workaround. Today, Microsoft partially lifted this limitation by supporting interactive pivots connected to Power BI datasets. Unfortunately, pivots connected to external Analysis Services models (both on-prem and cloud) still don’t support interactivity.

For some reason, this feature is called “connected PivotTable refresh” although a better name would be “interactive Excel pivots finally”. It works in Power BI Pro and Premium. Unlike the initial announcement that speculated that this feature would be available by simply uploading your Excel file to Power BI Service, it appears that it requires the Excel file to be uploaded to OneDrive or SharePoint Online. Here are the high-level steps that worked for me:

  1. Create your Excel pivot using the Analyze in Excel feature or directly from Excel. Assuming you have a recent Office 365 build, the latter option allows you to open Excel on the desktop and click Insert->Pivot Table->From Power BI to connect to a Power BI dataset from within Excel Desktop.
  2. Click Save As and save your workbook to OneDrive or SharePoint Online. Recall that you can specify a SharePoint site for storing workspace files in the Power BI workspace settings if you don’t want to upload the file to your personal folder.
  3. Use the Power BI Service “Get data” feature to upload (not import) the Excel workbook in a Power BI workspace. Again, the Excel workbook must be located either in OneDrive or SharePoint online.
  4. Interact with the report in Power BI Service, such by drilling down, drilling through, or even rebinding the report to different fields! As a bonus, when the underlying dataset refreshes, your pivot report will show the latest data as it connects live to the dataset.

The “connected PivotTable refresh” is a much-needed enhancement that brings the same interactive features to Excel pivot reports that users previously had in SharePoint Server. Now users who favor Excel pivots for interactive exploration can share their reports and the interactive features would be preserved when the report is rendered online. The feature requires storing the Excel workbook in OneDrive or SharePoint Online and using an Analyze in Excel connection. Unfortunately, it doesn’t work with Analysis Services models that are external to Power BI (not deployed to Power BI Service) which is another incentive to move your semantic models to Power BI as I’ve been advocating for some time.

Implementing a Default Date Filter in Tabular and Power BI

Problem: A long standing limitation in Analysis Services Tabular and Power BI is the lack of default members, such as to default a Date dimension to the last date with data. Users find this annoying, especially for time calculations which require a date context and won’t produce results until you add a date-related field to the report one way or other. To aggravate things even more, Tabular switched to a JSON schema in SQL Server 2016. The new schema is great for expressing the metadata in clear and more compact way. However, because it’s not extensiible, it precludes community tools, such as BIDS Helper (now called BI Developer Extensions) and DAX Editor, to extend Tabular features and fill in the gaps left by Microsoft.

Workaround: Currently, there is no way to default a field in Tabular and Power BI. For the most common requirement to default a date filter, consider adding a field to the Date table that flags the desired item. You can implement this in different ways. For example, in Excel you can create a named set, but this requires MDX knowledge that end users won’t have. And it won’t work in other report clients, such as Power BI Desktop. Here is an approach that is simple to implement and works everywhere.

  1. Flag the desired item using whatever way you’re comfortable with: SQL view, Power Query, or DAX. For example, if users prefer the date filter to default to yesterday and the Date table is based on a SQL view, add the following column to the view:
    CASE WHEN [Date] <= DATEADD(DAY,-1, CAST(GETDATE() AS DATE)) THEN ‘Yes’ ELSE ‘No’ END YesterdayFlag
    Notice that the flag qualifies all rows prior to and including yesterday. In your first attempt, you might try only an equal condition. This will work when the YesterdayFlag field is added as a filter to an Excel pivot table. However, if you attempt to configure it as an Excel slicer, it will result in the following error:
    Calculation error in measure ‘<your measure name>’: Function ‘SAMEPERIODLASTYEAR’ only works with contiguous date selections.
  2. Reimport the Date table in Tabular or Power BI.
  3. Set up a report filter. For example, in Excel define a slicer using the YesterdayFlag field and default it to Yes, if you want to filter all reports on the same sheet.

    The net effect is that as time progresses, the YesterdayFlag field will filter the Date table and measures will show the yesterday’s data by default. Time calculations will also work as of yesterday. For example, YTD calculations will aggregate from the beginning of the year until yesterday. And end users don’t need to bother about resetting date filters if viewing data as yesterday is the prevailing preference.

Help Improve Excel as Analysis Services Front End

Everyone has a different opinion about what self-service BI should be. But to many people the journey starts and stops with Microsoft Excel. Excel is the self-service BI nirvana. If the user can’t see and filter the detail data, even the most sophisticated self-service BI tool cannot be trusted. And since everyone knows how to do this in Excel, why should they use other tools? To me, the best self-service BI is empowering business users to connect to an organizational semantic model, ideally with Excel as a front end. Most of my current projects use Analysis Services Tabular for implementing semantic models. Therefore, it’s so frustrating that Excel still lacks good support for Tabular. For example, it splits a Tabular table into two tables (“dimension” and “measure group”) because Excel still uses the MDX interface. To make things worse, all fields in the “dimension” table has a Text data type because it gets only the field caption and not the data type. As a result, you can’t filter and compare date and number fields from the “dimension” tables.

According to Microsoft, a better Excel-Tabular combo hasn’t yet bubbled up high based on the feedback that the Excel team gets from customers. In an attempt to get the proper attention, I just posted the “Better Support for Analysis Services Tabular” wish list on Excel User Voice. I bundled multiple items into one wish list.

Please vote if you care.

It’s about time to improve support for SSAS Tabular:

1. Auto-generate DAX.

2. Avoid splitting a table into a “measure group” and “dimension”. See how PBI Desktop handles metadata.

3. Carry over data types so that users can create reports, such as show me invoices where Due Date is greater than … Currently, all dimension table fields map to Text.

4. Many customers have expressed interest in connecting Excel tables directly to Tabular, bypassing Pivot Table, so they can use the column dropdowns and other Excel Table goodness.

5. Support descriptions as tooltips when the user hovers on a field in the Field List.

Considerations for Detail Reports

Nobody likes watching a report spinny. Interactive detail reports that perform well from an Analysis Services semantic layer have been the bane of my BI career. A “detail report” is a report that requests data at a lower level, e.g. policy in the insurance business, customer in Sales, etc. A detail report typically has many dimension attributes, eustomer Name, Account Number, Product Name, Product Number, etc. And, the more columns you add, the slower the report gets. The reason why such reports don’t typically perform so well when generated from a semantic layer is that Analysis Services is not SQL Server.

Multidimensional is an attribute-based model and the server cross joins the member values when you add attributes to the report. Don’t be misled by the “relational” nature of Tabular either. Its database engine (xVelocity) is an in-memory columnar database that still cross joins the column values. That said, Tabular should give you a performance boost for two reasons. First, its in-memory nature is generally faster than Multidimensional. Second, Excel has been optimized for Tabular, as I explain in my “Optimizing Distinct Count Excel Reports” blog, thanks to the undocumented PreferredQueryPatterns settings (although not listed in the msmdsrv.ini, it defaults to 1).

In a recent project, I migrated a customer from Multidimensional to Tabular. Besides other benefits, such of elimination of snapshots, reducing dramatically ETL time and analyzing data as of any date (not just at the month end), the customer wanted to improve performance of Excel detail reports. Previously, some of the detail reports would never return. After the migration, these reports would execute within a minute, and in seconds if the Excel subtotals are disabled.

Here are some tips you might find useful if you’re tasked to produce detail reports:

  1. If the detail reports don’t require too much interactivity, consider implementing them as SSRS paginated reports that connect directly to the database. The chances are that this approach will give you the fastest performance as the Database Engine is designed to retrieve data in sets by rows and the number of columns won’t probably affect report performance (unless of course many joins are required).
  2. If it’s desired to connect these reports to a semantic layer, consider Tabular because it’s better for wide & flat results.
  3. If Excel is used as a front end, consider Excel 2016 as Microsoft has made various performance improvements for detail reports.
  4. Consider disabling Excel subtotals, as explained here. In my scenario, a detail report with no subtotals would execute under 15 seconds. However, if I enable just one column subtotal, Excel switches to a completely different query pattern (with many nested DrilldownMember levels) and the report query would take a minute. That’s because now the query needs to obtain the subtotals for each group from SSAS. Since we’re at the mercy of the Excel MDX query generator, I hope the Excel team finds a way to produce more optimal MDX queries. Ideally, a future Excel release would allow binding Excel native tables directly to SSAS with ability to define subtotals and optimized queries to load the data.
  5. In my experience, Power BI reports that generate DAX don’t perform necessarily any better. To make things worse, while the new PBI Matrix visual can be configured to a flattened layout, it doesn’t currently support disabling specific subtotals (currently, you can remove all row subtotals or have them for each and every column). And asking for subtotals for every column might not only contradict business requirements but it could also severely affect performance. UPDATE 8/14/2017 – The August release of Power BI Desktop supports configuring row subtotals per level.

Many thanks to Akshai Mirchandani for the SSAS product group for not losing patience throughout all these years from my complaints on this subject.

081217_1845_Considerati1.jpg

Automating Excel to Power BI Publishing

Excel 2016 added a Publish to Power BI menu to let you export or connect Excel workbooks to Power BI. You can read more about this Excel feature here. One area where Excel is still ahead of Power BI Desktop is that is has an object model that lets you automate tasks with VBA. Unfortunately, Power BI Desktop doesn’t have an object model so you have to resort to unsupported ways (aka hacks) to automate tasks, such as refreshing and publishing to Power BI. I discussed some here.

I’ve noticed that Microsoft added not yet documented PublishToPBI method to Excel 2016. With it, refreshing the Excel data model and publishing it to Power BI Service takes two lines of code (you’d need more code to open the Excel workbook from an external application).

Sub Macro1()

ActiveWorkbook.Model.Refresh

ActiveWorkbook.PublishToPBI PublishType:=msoPBIExport, nameConflict:= msoPBIAbort, bstrGroupName:=”<Some Workspace>”

End Sub

Downloads

7 Ways to Integrate Excel with Power BI

Slides from my presentation “7 Ways to Integrate Excel with Power BI”.

Power BI is gaining a momentum but Excel still rules the corporate world. Fortunately, Power BI and Excel are not exclusive choices. Join me to learn how you can preserve your Excel investment in Power BI. I’ll start by explaining the value Power BI brings to different types of users in your organization. Then, I’ll discuss and demo seven options for integrating Excel with Power BI:

  • Import Excel files in Power BI Service
  • Build self-service data models from Excel data
  • Deploy Excel models to Power BI
  • Convert Excel models to Power BI
  • Connect to Excel reports
  • Analyze Power BI datasets in Excel
  • Add Excel reports to Power BI dashboards