Posts

Solving the ACE Driver Bitness Madness

Scenario: You have installed Office 32-bit (I’m yet to see a company that installs 64-bit as IT loves default paths). Then, you install Power BI Desktop 64-bit. Upon trying to connect to some Office file, such as Access or Excel, you get a compatibility error. You try to install the 64-bit Microsoft Access Database Engine 2010 Redistributable but then you are greeted with “You have a 32-bit version of Office installed”.

Solution: Install the 64-bit Redistributable with the passive overwrite:

  1. Download the 64-bit Microsoft Access Database Engine redistributable.
  2. Open Command Prompt to the download location and execute the following command:
    AccessDatabaseEngine_X64.exe /passive

You can use a similar procedure to force the 32-bit driver if you have Office 64-bit.

What’s New for BI in Office 2016?

While you might be trying to convince management to upgrade to Office 2013, the next version of Microsoft Office (Office 2016) is on the horizon and scheduled to be released sometime in the Fall. Meanwhile, you can download and test the Public Preview. Naturally, you might wonder what’s new for BI given that Excel is the Microsoft premium BI desktop tool. In my newsletter, I’m sharing my favorite Excel 2016 BI features (most significant listed first).

Optimizing Distinct Count Excel Reports

I wonder how many people believe that Tabular DistinctCount outperforms Multidimensional judging by Excel reports alone. In this case, an insurance company reported a performance degradation with Excel reports connected to a multidimensional cube. One report was taking over three minutes to run and it was requesting multiple fields on rows (insured, insured state, insured city, policy number, policy year, underwriter, and a few more) and about a dozen measures, including several distinct count measures, such as claim count, open claim count, and so on. The report would only need subtotals on three of the fields added to the ROWS zone. The cube had about 20 GB a disk footprint so the data size is not the issue here. The real issue is the crappy MDX queries that Excel auto-generates because they are asking for subtotals for all fields added to ROWS, using the following pattern:

NON EMPTY CrossJoin(CrossJoin(CrossJoin(CrossJoin(CrossJoin(CrossJoin(CrossJoin(CrossJoin(

Hierarchize({DrilldownLevel({[Insured].[Insured Name].[All]},,,INCLUDE_CALC_MEMBERS)}),

Hierarchize({DrilldownLevel({[Insured].[Insured City].[All]},,,INCLUDE_CALC_MEMBERS)})),

Hierarchize({DrilldownLevel({[Insured].[Insured State].[All]},,,INCLUDE_CALC_MEMBERS)})),

Hierarchize({DrilldownLevel({[Policy Effective Date].[Year].[All]},,,INCLUDE_CALC_MEMBERS)})),

Hierarchize({DrilldownLevel({[Policy].[Natural Policy Key].[All]},,,INCLUDE_CALC_MEMBERS)})),…

As you can see, the query requests the ALL member of the hierarchy. By contrast, a smarter MDX query generator would request subtotals on the fields that need subtotals only. For example, a rewritten by hand query executes within milliseconds following this pattern:

Hierarchize({DrilldownLevel({[Insured].[Insured Name].[All]},,,INCLUDE_CALC_MEMBERS)}) *

Hierarchize({DrilldownLevel({[Insured].[Insured City].[Insured City].Members},,,INCLUDE_CALC_MEMBERS)})) *

Hierarchize({DrilldownLevel({[Insured].[Insured State].[Insured State].Members},,,INCLUDE_CALC_MEMBERS)}))…

But we can’t change the queries Excel generates and we are at the mercy of the MDX query generator. And, the more fields the report requests, the slower the query would be. DistinctCount measures aggravate the issue further. The problem is that the DC measures cannot be aggregated from caches at deeper levels. Therefore, increasing the number of granularities in the query increases the number of subcubes that are requested from the storage engine, and they’re not going to hit earlier subcubes unless they match at the exact granularity – which is unlikely when the query results are not cached. And at some point, the doubled subcube count will trigger the query degradation (you will see many “Getting data from partition” events in the Profiler). Many of these subcubes are really needed, but some of them are generated for subtotals that Excel doesn’t really need.

I actually logged this issue more than three years ago but the Office team didn’t bother. The original bug was with Power Pivot but the issue was the same. To Microsoft’s credit, the SSAS team introduced an undocumented and unsupported PreferredQueryPatterns setting for both Multidimensional and Tabular, which can be set in msmdsrv.ini (ConfigurationSettings\OLAP\Query\PreferredQueryPatterns). I don’t think it can be set in the connection string. Excel discovers when PreferredQueryPatterns is set to 1 and generates different (drilldown) query pattern instead of the original (crossjoin) pattern. Unfortunately, it looks like more work and testing were done on the Tabular side of things where PreferredQueryPatterns is actually set by default to 1 (although you won’t see it in msmdsrv.ini). I tried a Tabular version of the customer’s cube (only a subset of tables loaded with the biggest table about 50 mil rows fact snapshot and a few distinct count measures) to test with similar Excel queries. With the default configuration (PreferredQueryPatterns=1), Tabular outperformed MD by far (queries take about 3-5 seconds). Initially, I thought that Tabular fares better because of its in-memory nature. Then, I changed PreferredQueryPatterns to 0 on the Tabular instance and reran the Tabular test to send queries with the crossjoin pattern. Much to my surprise, Tabular performed worse than the original MD queries.

PreferredQueryPatterns is 0 by default with Multidimensional due to concerns over possible performance regressions. Indeed, my tests with setting PreferredQueryPatterns to 1 on MD, caused ever-increasing memory utilization until the server ran out of memory so unfortunately it was unusable for this customer. If customer approves, I plan to log a support case. Ideally, the Office team should fix this by auto-generating more efficient MDX queries. If no help on that end, the SSAS team should make PreferredQueryPatterns work with MD. BTW, I was able to optimize somewhat the MD reports by using member properties instead of attributes (from 3 min query execution time went down to 1 min) but that was pretty much the end of the optimization path.

Excel Timeline Slicers

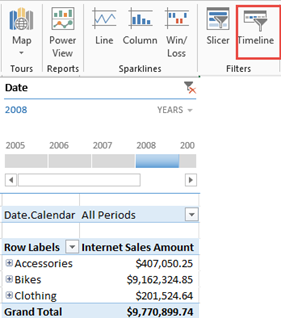
In an attempt to improve visualizations of Excel-based dashboards, Excel 2013 introduced a Timeline filter. Specifically designed to visualize dates, the Timeline filter works similarly to regular slicers which were introduced in Excel 2010. Similar to a regular slicer, Timeline connects at the connection level and is capable of filtering multiple reports. It supports also extended selections, such as to select multiple years.

080514_0129_ExcelTimeli1

However, there are important differences between Timeline and regular slicers which become important when you connect to Multidimensional.

  1. The Timeline slicer always generates a subselect clause in the resulting MDX query even if a single value is selected. Because of this, the CurrentMember of the Date dimension is not set and any time calculations that dependent on [Date].[Hierarchy].CurrentMember won’t work. By contrast, a regular slicer is more intelligent. If the user selection results in a single value, a WHERE clause is generated and CurrentMember works. If multiple values are selected then it generates a subselect and CurrentMember won’t work.
  2. If the report has a report-specific filter, such as in the example above, Timeline forces the filter to its default value (All Periods if the All member is the default member or whatever the default member is set to in the cube). If the default filter is overwritten in the cube, such as to default the date to the last date with data, the report-specific filter and the Timeline selection might result in an exclusive filter and then no results will be shown. By contrast, a regular slicer always passes the user selection to the report filters.

Here is a sample MDX query generated by Excel when Timeline is set to year 2007.

SELECT NON EMPTY Hierarchize({DrilldownLevel({[Product].[Product Categories].[All Products]},,,INCLUDE_CALC_MEMBERS)}) DIMENSION PROPERTIES PARENT_UNIQUE_NAME,HIERARCHY_UNIQUE_NAME ON COLUMNS FROM (SELECT Filter([Date].[Date].Levels(1).AllMembers, ([Date].[Date].CurrentMember.MemberValue>=CDate(“2007-01-01”) AND [Date].[Date].CurrentMember.MemberValue<CDate(“2008-01-01”))) ON COLUMNS FROM [Adventure Works]) WHERE ([Date].[Calendar].[All Periods],[Measures].[Internet Sales Amount]) CELL PROPERTIES VALUE, FORMAT_STRING, LANGUAGE, BACK_COLOR, FORE_COLOR, FONT_FLAGS

And here is the resulting MDX from a regular slicer set to year 2007 (notice the WHERE clause):
SELECT NON EMPTY Hierarchize({DrilldownLevel({[Product].[Product Categories].[All Products]},,,INCLUDE_CALC_MEMBERS)}) DIMENSION PROPERTIES PARENT_UNIQUE_NAME,HIERARCHY_UNIQUE_NAME ON COLUMNS
FROM [Adventure Works] WHERE ([Date].[Calendar].[Calendar Year].&[2007],[Measures].[Internet Sales Amount])
CELL PROPERTIES VALUE, FORMAT_STRING, LANGUAGE, BACK_COLOR, FORE_COLOR, FONT_FLAGS

If you decide to use Timeline, use it only with reports that don’t include calculations that rely on date current member. Ideally, a future Excel enhancement would make Timeline behave as a regular slicer to increase its usefulness and align its behavior with regular slicers.

The Power Pivot Update Story

The Power Pivot update story is somewhat convoluted. Excel 2013 integrates Power Pivot natively and the only way to get it updated (assuming the traditional MSI installation option) is through Office updates because the Office team now owns its distribution. Alternatively, if you have an Office 365 subscription, and have installed Office 2013 via the click-to-run option, then the Office and Power Pivot updates will be pushed to you automatically.

With Excel 2010, Power Pivot is an external add-in that can be updated from the Microsoft download center. While the Excel 2013 Power Pivot bits are installed in the %Program Files%\Microsoft Office\Office15\ADDINS\PowerPivot Excel Add-in, the Excel 2010 Power Pivot add-in is installed in a different location: %Program Files%\Microsoft Analysis Services\AS Excel Client\110.

The interesting side effect is that the Excel 2010 Power Pivot can be updated more frequently (for example, every time there is a SQL Server 2012 service pack or cumulative update), while Excel 2013 MSI users must wait for an office update (distributed via Windows Update for MSI installer) or via O365 updates.

To make the whole story short:

  1. If you have Excel 2010, use the latest Power Pivot bits available on the Microsoft Download Center.
  2. If you have both Excel 2010 and 2013, use the Microsoft Download center to get Excel 2010 updated. Excel 2013 won’t.
  3. If you have Excel 2013 only, wait for Office updates.

When Dynamic Sets Are Not Dynamic

In my “Optimizing Dimension Data Security” blog, I’ve mentioned that converting static sets to dynamic could reduce the connection initialization time. To my surprise, using Excel to connect to the cube triggered the executing of dynamic sets and end users reported long wait times for the connection to initialize. It turned out that when Excel connects to the cube, it issues DISCOVER statements to query the metadata. One of these statements queries MDSCHEMA_SETS to find out what sets are available in the cube. For some obscure reason, this triggers the actual set evaluation for dynamic sets. If the set is expensive, e.g. touches all partitions, the DISCOVER statement can surely delay the connect time.

It turned out that other users are experiencing the same issue even if security is not applied. Greg Galloway found a workaround and extended the Analysis Services Stored Procedure project with a CurrentCommandIsDiscover method. You can use this method to check if the tool sends a DISCOVER command in your dynamic set definition and short-circuit the set evaluation, like so:

Create Dynamic Set CurrentCube.[Top 25 Selling Products] As

IIf(

ASSP.CurrentCommandIsDiscover(),

Head([Product].[Product].[Product].Members,0),

TopCount

(

[Product].[Product].[Product].Members,

25,

[Measures].[Sales Amount]

)

),

Display_Folder = ‘Sets’;

The Office Click-To-Run Setup

As you’ve probably head, Office 2013 supports now two installation options: the traditional MSI-based installation and the new Click-To-Run streaming installation. Chris Webb mentioned about it here and Melissa Coates describes how it works in more details here. The MSI setup is a perpetual one (you pay for a version once and you’re entitled to fixes for it) while the C2R setup is a subscription-based Office 365 setup (you continuously pay for using the software and you’re entitled to fixes and the latest features within the SKU you’re subscribed to). Perpetual installations will get updates (cumulative updates and service packs) just like they’re used to but they are meant primarily to be fixes rather than features. On the other hand, Office 365 subscribers have the benefit of getting fixes and new features as long as their subscription is active. Currently, there is no way to switch your existing Office installation from MSI to subscriber-based or vice versa. You must uninstall Office 2013 and reinstall. Once you do this, you’ll find that there is no difference as far as user experience. C2R still installs Office on the desktop although in different location.

The C2R setup has important ramifications on self-service BI. C2R users will have an always up-to-date service allowing Microsoft to add new functionality to the Office applications at a much faster rate. We’ve already seen this with the synonyms feature that are used for natural queries, aka Q&A (Q&A requires Power BI). Although I’ve initially dismissed the streaming installation, the C2R option now seems very attractive. I’ve already have an Office 365 subscription for e-mail and SharePoint. Shelving a few more bucks to upgrade to Power BI and stay on the latest and greatest seems like a good value proposition because I don’t have to wait for Office.NEXT to get the latest and greatest. More information about Office 365 plans can be found here. As an extension to Office 365, Power BI charges a premium as explained here.

A roadmap of C2R planned features is currently in the works so customers know the details of what’s coming up and when.

What’s New in Office 2013 BI: Part 3 – Improved Productivity

Excel 2013 includes features that improve productivity. Here are the ones related to BI.

Flash Fill

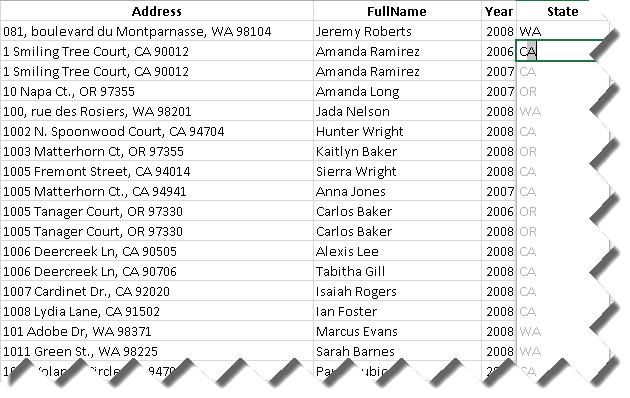
Suppose that you have a list of customers with addresses. When analyzing the data, you might want to analyze sales by USA states but the data doesn’t include a state column. Instead, suppose you have an address column that includes the mailing address, state, and zip code. So, you decide to create a new column. Now, instead of using a formula to parse the address as you would do in the past, you just enter WA in the first row. When you start typing CA in the second row, Excel figures the pattern and suggests to flash-fill the column. Notice that Flash Fill doesn’t use Excel formulas and you won’t get formulas in the column. Excel handles flash fill natively.

073012_0145_WhatsNewinO1

Quick Explore

This feature was included to allow you to quickly generate charts for analyzing data by time with Multidimensional and Tabular models. When you click a cell in a pivot report, the Quick Explore button is shown that gives you options to create trend or cycle chart. Notice that you can select another date dimension (table) to replace the default selection of Date.Calendar Date.

Note Excel 2013 charts don’t require supporting sheets with pivot reports anymore.

073012_0145_WhatsNewinO2

Speaking about analysis by time, Excel adds a new fitter, called “timeline”, that is specifically designed for this purpose. I found it an improved version of the Power View filter for integer fields. You can click a section in the timeline to select a specific period. Or, you can drag the mouse for an extended selection, such as years 2005-2007.

073012_0145_WhatsNewinO3

Quick Analysis

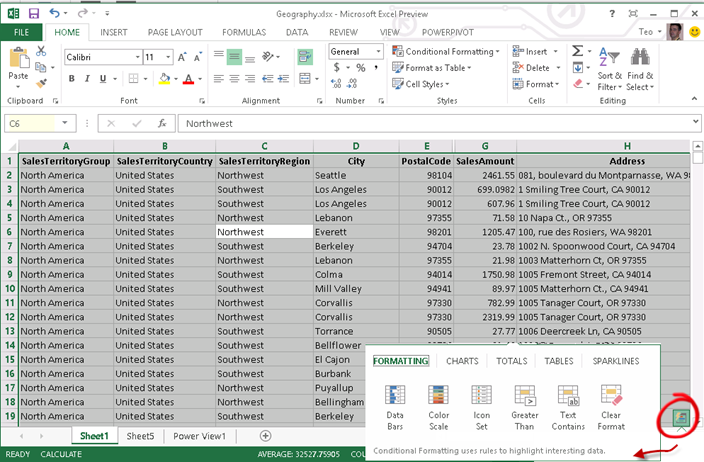
Suppose you have an Excel table but you don’t know much about pivot table, charts, and formatting. You can simply select the list (Ctrl+A) and click the Quick Analysis button to open a window that examines the dataset and suggests formatting (data bars, color scales, and conditional formatting, charts, tables, and sparklines.

073012_0145_WhatsNewinO4

What’s New in Office 2013 BI: Part 2 – Power View Enhancements

[View:https://prologika.com/CS/cfs-file.ashx/__key/CommunityServer.Blogs.Components.WeblogFiles/blog/7762.Geography.xlsx:550:0]

Power View in Office 2013 brings the following new features:

  • Integration with Excel 2013 – Microsoft has decoupled Power View from SharePoint and included it in Excel so you can create ad-hoc reports connected to BI models, just like you can create pivot reports. I hope the PerformancePoint Decomposition Tree will follow suit.
  • New visualizations – This includes interactive and drillable geospatial maps and pie charts.
  • Better support of tabular models – Power View now supports key performance indicators (KPIs) and hierarchies.
  • Design and branding enhancements – You can now insert images and change the report theme.

To showcase some of these enhancements, I created a personal BI model based on a customer dataset imported from the AdventureWorksDW2012 database (I attached the Excel workbook). To create a Power View report, click on Insert ð Power View button in the Excel ribbon. This creates an empty Power View report connected to the BI model.

My dataset includes the customer location defined as address, postal code, city, state, and country. I’ve found two ways to visualize geospatial data:

  1. Use longitude and latitude coordinates – Power View doesn’t support SQL Server geography data types. However, if you have a geography data type, extracting the longitude and latitude values is easy. You just need to query the Lat and Long property of the geography data type.

    SELECT SpatialLocation.Lat, SpatialLocation.Long FROM Person.Address 

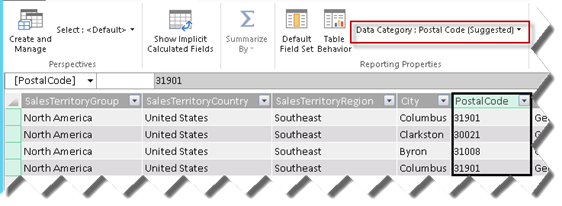
  2. Geocode from an address. If you drop an address field to the Locations zone, the map will prompt you to geocode it. Power Pivot also supports advanced properties and it tries to infer automatically known field categories. For example, in the screenshot below, Power View has identified that the PostalCode field contains zip codes and mapped it to the Postal Code category.

072612_0026_WhatsNewinO1

If you place multiple fields in the Locations zone, Power View will allow you to drill down these fields. In my case, I put the StateProvinceName and PostalCode fields in the Locations zone. Consequently, if I double-click on a bubble, Power View will zoom in the map to show me where my customers are located by postal code within that state. I can click the “drill up” in the map right upper corner to go back to the state level.

Note Not sure if this is a bug with the pre-release version of Office 2013, but Power View seems to have a problem with drilling down to entities with the same name. For example, initially I put the City field in the Locations zone but when I drilled down Georgia, Power View switched to Columbus, Ohio because both Ohio and Georgia have a city Columbus. It appears that Power View drills down to the first entity in finds in that level instead of constraining the list to the parent’s children only.

072612_0026_WhatsNewinO2

The Power View report also shows a pie chart. If I click a segment on the pie chart it cross-filters the map. For example, if I click the 2005 pie, the map highlights customers with sales in 2005. Vice versa, if I click a bubble in the map, the pie chart gets updated to show the data for that bubble only, such as sales for customers in Georgia. The field list shows that Power View now supports KPIs and hierarchies. The Gross Sales is defined as a KPI in the underlying model and Customers by Country is defined as a hierarchy. Finally, you can change the report theme and add images from the Excel’s Power View ribbon.

072612_0026_WhatsNewinO3

Office 2013 Business Intelligence Highlights

Jen Underwood wrote a great summary about what’s new in Office 13 BI. Interestingly, you’ll be able to drill down to lower location in the Power View maps, e.g. from country to state and then to lowest level you placed in the location zone when configuring the map visualization.