For years users have been asking for Excel tables (not pivots) connected to SSAS so they can simply browse the data in a tabular format not subjected to the shortcomings of pivots. And for years Excel has been supporting just pivots that natively understand only SSAS OLAP cubes. Is Power BI changing things? Somewhat. Enter refined Excel connected tables. They look great on the surface. You go through a wizard that lets you select and filter your data and you get an Excel table connected to a Power BI dataset. Awesome, right?
Unfortunately, what’s missing is the Field List. To make the feature useful, the user should be able to access the Field List and remove, add, filter, as they can do with pivots. However, once the table is generated, to change it you either must go through the wizard again or change the DAX query (right-click the table, click Table, and then Edit Query). Down the DAX rabbit hole we go again…
As they stand, Excel connected tables are not an interactive browsing tool. Instead, they are geared towards making Power BI datasets accessible in Excel.
Since I lost hope that Excel will discover Tabular and DAX one day, I hope the community will step in to fill in the gap by providing UI like the Pivot Field List so that the user doesn’t need to mess with DAX when all that’s needed is an Excel connected table for ad-hoc data exploration.
Atlanta BI fans, please join us for the next meeting on Monday, September 11th, at 6:30 PM ET. Shabnam Waston (BI Consultant and Microsoft MVP) will introduce us to the Lakehouse engine in Microsoft Fabric. Shabnam will also sponsor the meeting. Your humble correspondent will help you catch up on Microsoft BI latest. For more details and sign up, visit our group page.
PLEASE NOTE A CHANGE TO OUR MEETING POLICY. WE HAVE DISCONTINUED ONLINE MEETINGS VIA TEAMS. THIS GROUP MEETS ONLY IN PERSON. WE WON’T RECORD MEETINGS ANYMORE. THEREFORE, AS DURING THE PRE-PANDEMIC TIMES, PLEASE RSVP AND ATTEND IN PERSON IF YOU ARE INTERESTED IN THIS MEETING.
Presentation: Introducing Lakehouse in Microsoft Fabric
Delivery: Onsite
Date: September 11th
Time: 18:30 – 20:30 ET
Level: Beginner to Intermediate
Food: Sponsor wanted
Agenda:
18:15-18:30 Registration and networking
18:30-19:00 Organizer and sponsor time (events, Power BI latest, sponsor marketing)
19:00-20:15 Main presentation
20:15-20:30 Q&A
VENUE
Improving Office 11675 Rainwater Dr Suite #100 Alpharetta, GA 30009
Overview: Join this session to learn about Lakehouse architecture in Microsoft Fabric. Microsoft Fabric is an end-to-end big data analytics platform that offers many capabilities including data integration, data engineering, data science, data lake, data warehouse, and many more, all in one unified SaaS model. In this session, you will learn how to create a lakehouse in Microsoft Fabric, load it with sample data using Notebooks/Pipelines, and work with its built-in SQL Endpoint as well as its default Power BI dataset which uses a brand-new storage mode called Direct Lake.
Speaker: Shabnam Watson is a Business Intelligence consultant, speaker, blogger, and Microsoft Data Platform MVP with 20+ years of experience developing Data Warehouse and Business Intelligence solutions. Her work focus within the Microsoft BI Stack has been on Analysis Services and Power BI and most recently on Azure Synapse Analytics. She has worked across several industries including Supply Chain, Finance, Retail, Insurance, and Health Care. Her areas of interest include Power BI, Analysis Services, Performance Tuning, PowerShell, DevOps, Azure, Natural Language Processing, and AI. She is a regular speaker and volunteer at national and local user groups and conferences. She holds a bachelor’s degree in computer engineering and a master’s degree in computer science.
Sponsor: Shabnam Watson
https://prologika.com/wp-content/uploads/2016/01/logo.png00Prologika - Teo Lachevhttps://prologika.com/wp-content/uploads/2016/01/logo.pngPrologika - Teo Lachev2023-09-05 17:01:182023-09-05 17:01:18Atlanta Microsoft BI Group Meeting on September 11th (Introducing Lakehouse in Microsoft Fabric)
Atlanta BI fans, please join us for the next meeting on Monday, August 7th, at 6:30 PM ET. James Serra (Data & AI Solution Architect at Microsoft) will join us remotely to introduce us to Microsoft Fabric. For more details and sign up, visit our group page.
PLEASE NOTE A CHANGE TO OUR MEETING POLICY. WE HAVE DISCONTINUED ONLINE MEETINGS VIA TEAMS. THIS GROUP MEETS ONLY IN PERSON. WE WON’T RECORD MEETINGS ANYMORE. THEREFORE, AS DURING THE PRE-PANDEMIC TIMES, PLEASE RSVP AND ATTEND IN PERSON IF YOU ARE INTERESTED IN THIS MEETING.
Presentation: Introducing Microsoft Fabric
Delivery: Speaker will join us remotely via Teams
Date: August 7th
Time: 18:30 – 20:30 ET
Level: Beginner
Food: Sponsor wanted
Agenda:
18:15-18:30 Registration and networking
18:30-19:00 Organizer and sponsor time (events, Power BI latest, sponsor marketing)
19:00-20:15 Main presentation
20:15-20:30 Q&A
ONSITE
Improving Office 11675 Rainwater Dr Suite #100 Alpharetta, GA 30009
Overview: Microsoft Fabric is the next version of Azure Data Factory, Azure Data Explorer, Azure Synapse Analytics, and Power BI. It brings all these capabilities together into a single unified analytics platform that goes from the data lake to the business user in a SaaS-like environment. Therefore, the vision of Fabric is to be a one-stop shop for all the analytical needs for every enterprise and one platform for everyone from a citizen developer to a data engineer. Fabric will cover the complete spectrum of services including data movement, data lake, data engineering, data integration and data science, observational analytics, and business intelligence. With Fabric, there is no need to stitch together different services from multiple vendors. Instead, the customer enjoys end-to-end, highly integrated, single offering that is easy to understand, onboard, create and operate.
This is a hugely important new product from Microsoft, and I will simplify your understanding of it via a presentation and demo.
Speaker: James Serra works at Microsoft as a big data and data warehousing solution architect where he has been for most of the last nine years. He is a thought leader in the use and application of Big Data and advanced analytics, including data architectures, such as the modern data warehouse, data lakehouse, data fabric, and data mesh. Previously he was an independent consultant working as a Data Warehouse/Business Intelligence architect and developer. He is a prior SQL Server MVP with over 35 years of IT experience. He is a popular blogger (JamesSerra.com) and speaker, having presented at dozens of major events including SQLBits, PASS Summit, Data Summit and the Enterprise Data World conference. He is the author of the upcoming book “Deciphering Data Architectures: Choosing Between a Modern Data Warehouse, Data Fabric, Data Lakehouse, and Data Mesh”.
https://prologika.com/wp-content/uploads/2016/01/logo.png00Prologika - Teo Lachevhttps://prologika.com/wp-content/uploads/2016/01/logo.pngPrologika - Teo Lachev2023-08-01 11:13:522023-08-01 11:13:52Atlanta Microsoft BI Group Meeting on August 7th (Introducing Microsoft Fabric)
Is it getting better? Or do you feel the same? Will it make it easier on you now? You got someone to blame
U2
Likely influenced by the Gartner’s Fabric vision, Microsoft Fabric is eclipsing all things Power BI nowadays to the extent of replacing the strong Power BI brand and logo with Fabric’s. Now that the red star Synapse has imploded into a black hole, Fabric has taken its place and it’s engulfing everything in its path.
But to digress from Fabric, let’s take a look at two developer-oriented and frequently requested features that fortunately doesn’t require Fabric: Power BI Desktop projects and workspace integration with Git. The video in the link is a good starting point to understand how these features work.
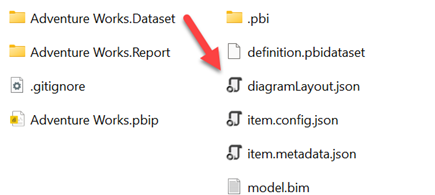
Basically, the first feature lets you save a Power BI Desktop file as a *.pbip file which generates a set of folders with human-readable text files, such as the model.bim file (has the model definition described in JSON). Next, you can put these files under source control using any source control-enabled tool, such as Visual Studio Code or Visual Studio. Currently in preview, Power BI projects is an experimental feature (in fact, the Publish button is disabled so you can’t publish a project to Power BI Service).
The second feature (workspace integration with Git) lets you configure a workspace to keep Power BI reports and datasets published to the workspace under source control. No other items are currently supported (even paginated reports). This feature is independent of the client-side project mode and it doesn’t require saving Power BI Desktop files as projects.
The Good
Although the primary target of PBI Desktop projects is to enable source control, a more useful side effect to me is that we can now get to and edit the report schema.
The other day someone asked me how you can apply conditional settings of one field in a visual to another. Or, how can you replace the field that has conditional settings applied without loosing them. Well, with some JSON wizardry, you can open the report.json file and make the changes there. At your risk of course because the report schema is ugly and not documented.
I also commend Microsoft for supporting Power BI workspace Git integration in Premium Per User (PPU) licensing to make it more accessible (unfortunately, it’s not available to the masses operating on Power BI Pro). I like the two-way integration in a Git-enabled workspace. It works like Azure Data Factory, so I don’t have to configure source control on the client.
The Bad
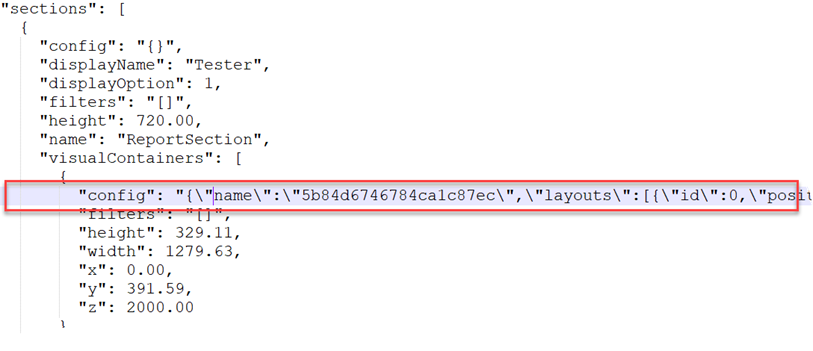
The report JSON schema is not documented and as such source code compare is difficult. Parsing a name-value collection in the visual’s config section is required to get to the useful staff.
I hope at some point Microsoft will simplify and document the report schema to let the community take over where Microsoft left off and create tools to compare the report definition.
Naturally, I’d like to see Git integration supporting all workspace items, such as paginated reports, dashboards, and Fabric artifacts.
The Ugly
If you follow my blog, you know that I’m not a big fan of Power BI Desktop for semantic modeling. Instead, I rely on Tabular Editor. When in pbix mode, changes saved in Tabular Editor appear in Power BI Desktop (the reverse is not true). That’s because Tabular Editor connected to a pbix file actually connects to the running instance of the Analysis Services engine and applies changes there. It edits the same in-memory model that PBI Desktop is connected to, thus allowing PBI Desktop to automatically refresh metadata changes.
By contrast, changes made in Tabular Editor in project mode are not reflected in Power BI Desktop.
That’s because changes made in Tabular Editor in project mode are written to the model.bim file and you need to close and open PBI Desktop for these changes to appear. This can get tedious very quickly. My recommendation would be for Power BI Desktop to listen to file changes and automatically refresh the metadata.
Summary
I’ll wait for the project mode feature to mature on the client. Meanwhile, I’ll continue with *.pbix and enable source control integration at the workspace level for clients on PPU or higher licensing. With Power BI Pro licensing, I’ll continue putting the model.bim file from Tabular Editor under source control (no source control for reports).
https://prologika.com/wp-content/uploads/2016/01/logo.png00Prologika - Teo Lachevhttps://prologika.com/wp-content/uploads/2016/01/logo.pngPrologika - Teo Lachev2023-07-09 13:31:252023-07-18 14:01:40Power BI Projects and Git Integration: The Good, the Bad, and the Ugly
Atlanta BI fans, please join us for the next meeting on Tuesday, July 11th, at 6:30 PM ET. Stacey Jones (Cross Solution Architect at Microsoft) will join us in person to present OpenAI and Copilot. Your humble correspondent will demo the newly released PBI Desktop project format. For more details and sign up, visit our group page.
PLEASE NOTE A CHANGE TO OUR MEETING POLICY. EFFECTIVE IMMEDIATELY, WE ARE DISCONTINUING ONLINE MEETINGS VIA TEAMS. THIS GROUP MEETS ONLY IN PERSON. WE WON’T RECORD MEETINGS ANYMORE. THEREFORE, AS DURING THE PRE-PANDEMIC TIMES, PLEASE RSVP AND ATTEND IN PERSON IF YOU ARE INTERESTED IN THIS MEETING.
Presentation: Azure OpenAI – Answers to Your Natural Language Questions
Date: July 11th (Please note that because of the July 4th holiday, this meeting is on Tuesday)
Time: 18:30 – 20:30 ET
Level: Intermediate
Food: As of now, food won’t be available for this meeting. We are welcoming suggestions for a sponsor.
Agenda:
18:15-18:30 Registration and networking
18:30-19:00 Organizer and sponsor time (events, Power BI latest, sponsor marketing)
19:00-20:15 Main presentation
20:15-20:30 Q&A
ONSITE
Improving Office
11675 Rainwater Dr
Suite #100
Alpharetta, GA 30009
Overview: We will overview and explore Azure OpenAI, a fusion of OpenAI with the Azure cloud. Understand what OpenAI and CoPilot are as well as how they can help you with your natural language questions. We will also address questions about AI, such as will AI take over the world?
Speaker: Stacey Jones is a Cross Solution Architect specializing in all things Data, AI and Power BI. He is Evangelist at Microsoft’s Technology Center (MTC) in Atlanta, GA. He has 30+ years of industry experience in technology management spanning data architecture, data modeling, database development, tuning, and administration in both Oracle and SQL Server. He is active on LinkedIn and has plenty of real-life experience putting out database performance fires.
https://prologika.com/wp-content/uploads/2016/01/logo.png00Prologika - Teo Lachevhttps://prologika.com/wp-content/uploads/2016/01/logo.pngPrologika - Teo Lachev2023-07-05 07:41:242023-07-05 07:41:24Atlanta Microsoft BI Group Meeting on July 11th (Azure OpenAI – Answers to Your Natural Language Questions)
Please join us for the next meeting on Monday, June 5th, at 6:30 PM ET. Kristyna Hughes (Senior data & analytics consultant at 3Cloud will join us remotely and share best practices for dissecting a complicated and broken Power BI report and a checklist of how to fix it. Improving will sponsor the meeting. Your humble correspondent will demonstrate how Power BI can integrate better with SharePoint and OneDrive. For more details and sign up, visit our group page.
WE NOW MEET BOTH IN-PERSON AND ONLINE. WE STRONGLY ENCOURAGE YOU TO ATTEND THE EVENT IN PERSON FOR BEST EXPERIENCE AND BECAUSE AN EMPTY AUDIENCE IS DISCOURAGING TO SPEAKERS AND SPONSORS. ALTERNATIVELY, YOU CAN JOIN OUR MEETINGS ONLINE VIA MS TEAMS. WHEN POSSIBLE, WE WILL RECORD THE MEETINGS AND MAKE RECORDINGS AVAILABLE HERE.
PLEASE RSVP ONLY IF COMING TO OUR IN-PERSON MEETING AND PLAN TO EAT
Presentation: How to Fix an Inherited Power BI Report
Date: June 5th
Time: 18:30 – 20:30 ET
Place: Onsite and online
Level: Intermediate
Food: Food and drinks will be available for this meeting
Agenda:
18:15-18:30 Registration and networking
18:30-19:00 Organizer and sponsor time (events, Power BI latest, sponsor marketing)
Overview: A common request in the realm of reporting is “hey, we have this report that a previous VIP used, but the report is really slow and the new VIP would like to revamp the report to answer their questions”. Great, you think, I can knock this out no problem! Then, you open the report. Fifty tables, over a hundred measures, and six calculated tables later you start to panic.
This session will go into best practices for dissecting a complicated report and a checklist for quick wins. No need to panic, this session will help build a toolbelt to tackle any reconstruction project.
Speaker: Kristyna Hughes is a senior data & analytics consultant at 3Cloud. Her experience includes implementing and managing enterprise-level Power BI instance, training teams on reporting best practices, and building templates for scalable analytics. Passionate about participating and growing the data community, she enjoys co-writing on Data on Wheels (dataonwheels.com) and has recently co-founded Data on Rails (dataonrailsblog.com). She also is on the board of directors for PASS MN and is a co-organizer for Lexington Data Technology Group.
Sponsor: Improving
Sponsor: TBD
https://prologika.com/wp-content/uploads/2016/01/logo.png00Prologika - Teo Lachevhttps://prologika.com/wp-content/uploads/2016/01/logo.pngPrologika - Teo Lachev2023-05-29 13:55:072023-05-29 13:55:07Atlanta Microsoft BI Group Meeting on June 5th (How to Fix an Inherited Power BI Report)
Please join us for the next meeting on Monday, May 1st, at 6:30 PM ET. Akshata Revankar (Data Engineer, Specialist at McKinsey & Company) will show you how to leverage Power BI deployment pipelines to promote content changes between environments, such as DEV and PROD. For more details and sign up, visit our group page.
WE NOW MEET BOTH IN-PERSON AND ONLINE. WE STRONGLY ENCOURAGE YOU TO ATTEND THE EVENT IN PERSON FOR BEST EXPERIENCE AND BECAUSE AN EMPTY AUDIENCE IS DISCOURAGING TO SPEAKERS AND SPONSORS. ALTERNATIVELY, YOU CAN JOIN OUR MEETINGS ONLINE VIA MS TEAMS. WHEN POSSIBLE, WE WILL RECORD THE MEETINGS AND MAKE RECORDINGS AVAILABLE HERE.
PLEASE RSVP ONLY IF COMING TO OUR IN-PERSON MEETING AND PLAN TO EAT
Presentation: Getting started with Power BI Deployment Pipelines Date: May 1st Time: 18:30 – 20:30 ET Place: Onsite and online Level: Intermediate Food: Food and drinks will be available for this meeting
Agenda: 18:15-18:30 Registration and networking 18:30-19:00 Organizer and sponsor time (events, Power BI latest, sponsor marketing) 19:00-20:15 Main presentation 20:15-20:30 Q&A
ONSITE (RECOMMENDED) Improving Office 11675 Rainwater Dr. Suite #100 Alpharetta, GA 30009
Overview: If you are wondering, “Is CI/CD possible in Power BI?” , the answer is YES! and this can be achieved with “Deployment Pipelines”. With Deployment Pipelines, it’s now possible to move content smoothly from Development/Test to QA to Production, helping enterprise BI teams bring application lifecycle management to their power BI environments. · Understand deployment pipelines · Create a deployment pipeline · Deploy content with rules · Comparing Content · Move content from one stage to next.
Speaker: Akshata Revankar (Data Engineer, Specialist at McKinsey & Company) has 16+ Years of experience in data engineering and data reporting space. Have worked with Oracle database, SQL Server, SSIS, Informatica Power Center, Hadoop systems, Qlik and Power BI. Enjoy being in the data space and learning new things.
Sponsor: TBD
https://prologika.com/wp-content/uploads/2016/01/logo.png00Prologika - Teo Lachevhttps://prologika.com/wp-content/uploads/2016/01/logo.pngPrologika - Teo Lachev2023-04-19 11:05:012023-04-19 13:15:37Atlanta MS BI and Power BI Group Meeting on May 1st (Getting started with Power BI Deployment Pipelines)
Please join us for the next meeting on Monday, April 3rd, at 6:30 PM ET. Your humble correspondent will revisit Power BI important fundamentals in a demo-packed session. For more details and sign up, visit our group page.
PLEASE NOTE THAT OUR IN-PERSON MEETING LOCATION HAS CHANGED! WE STRONGLY ENCOURAGE YOU TO ATTEND THE EVENT IN PERSON FOR BEST EXPERIENCE. ALTERNATIVELY, YOU CAN JOIN OUR MEETINGS ONLINE VIA MS TEAMS. WHEN POSSIBLE, WE WILL RECORD THE MEETINGS AND MAKE RECORDINGS AVAILABLE AT HTTPS://BIT.LY/ATLANTABIRECS. PLEASE RSVP ONLY IF COMING TO OUR IN-PERSON MEETING.
Presentation: Power BI Dashboard in an Hour (DIAH)
Date: April 3rd
Time: 18:30 – 20:30 ET
Place: Onsite and online
Level: Beginner
Food: Food and drinks will be available for this meeting
Agenda:
18:15-18:30 Registration and networking
18:30-19:00 Organizer and sponsor time (events, Power BI latest, sponsor marketing)
Targeting novice Power BI users, this hands-on, no-slide session covers important Power BI fundamentals and best practices. If you’re already a Power BI user, you’ll probably learn a new trick or two. And if you like a challenge, bring your laptop and try to keep up through the steps to create a Power BI dashboard!
Join us and learn how to:
Design your BI model
Acquire and transform data
Turning data into valuable and interactive insights
Sharing your visualizations with others
Speaker: Teo Lachev is a consultant, author, and mentor, with a focus on Microsoft BI. Through his Atlanta-based company Prologika he designs and implements innovative solutions that bring tremendous value to his clients. Teo has authored and co-authored several books, and he has been leading the Atlanta Microsoft Business Intelligence group since he founded it in 2010. Microsoft has recognized Teo’s contributions to the community by awarding him the prestigious Microsoft Most Valuable Professional (MVP) Data Platform status for 15 years. Microsoft selected Teo as one of only 30 FastTrack Solution Architects for Power BI worldwide.
Sponsor: Improving
Prototypes with Pizza: Power BI Latest with Teo Lachev
https://prologika.com/wp-content/uploads/2016/01/logo.png00Prologika - Teo Lachevhttps://prologika.com/wp-content/uploads/2016/01/logo.pngPrologika - Teo Lachev2023-03-28 13:40:512023-03-28 13:41:45Atlanta MS BI and Power BI Group Meeting on April 3rd (Power BI Dashboard in an Hour)
Please join us for the next meeting on Monday, March 6th, at 6:30 PM ET. Leo Furlong (Senior Solutions Architect at Databricks) will share their point of view on why “the best data warehouse is a lakehouse.” For more details and sign up, visit our group page.
PLEASE NOTE THAT OUR IN-PERSON MEETING LOCATION HAS CHANGED! WE STRONGLY ENCOURAGE YOU TO ATTEND THE EVENT IN PERSON FOR BEST EXPERIENCE. ALTERNATIVELY, YOU CAN JOIN OUR MEETINGS ONLINE VIA MS TEAMS. WHEN POSSIBLE, WE WILL RECORD THE MEETINGS AND MAKE RECORDINGS AVAILABLE AT HTTPS://BIT.LY/ATLANTABIRECS. PLEASE RSVP ONLY IF COMING TO OUR IN-PERSON MEETING.
Presentation: The Semantic Lakehouse: Power BI and Databricks
Date: March 6th
Time: 18:30 – 20:30 ET
Place: Onsite and online
Level: Intermediate
Food: Food and drinks will be available for this meeting
Agenda:
18:15-18:30 Registration and networking
18:30-19:00 Organizer and sponsor time (events, Power BI latest, sponsor marketing)
Overview: The team from Databricks will come and share their point of view on why “the best data warehouse is a lakehouse.” We’ll go over lakehouse 101, when you might (or might not!) need a lakehouse, some best practices for operating a BI solution with Databricks, and walk through a demo highlighting how PowerBI’s and Databricks’ SQL capabilities complement each other.
Speaker: Leo Furlong, Senior Solutions Architect at Databricks Leo is a seasoned data and analytics professional with 15 years of consulting experience building Data Warehousing and BI solutions using SQL Server, Power BI, and Azure technologies prior to joining Databricks in 2021. As an Atlanta native, Leo is a Georgia Tech and Georgia State grad and lives in the Smyrna/Vinings area with his 4 kids and 4 dogs.
Sponsor: Databricks
Prototypes with Pizza: Power BI Latest with Teo Lachev
https://prologika.com/wp-content/uploads/2016/01/logo.png00Prologika - Teo Lachevhttps://prologika.com/wp-content/uploads/2016/01/logo.pngPrologika - Teo Lachev2023-03-03 15:37:022023-03-03 15:37:02Atlanta MS BI and Power BI Group Meeting on March 6th (The Semantic Lakehouse: Power BI and Databricks)
I’m presenting at SQL Saturday Atlanta 2023 – BI & Data Analytics Edition on February 25th at 9 AM (the very first slot in the very first room for very first early birds). I’ll do a Power BI Dashboard in an Hour this time to revisit the basics. I hope to see some of you there.
Targeting novice Power BI users, this hands-on, no-slide session covers important Power BI fundamentals and best practices. If you’re already a Power BI user, you’ll probably learn a new trick or two. And if you like a challenge, bring your laptop and try to keep up through the steps to create a Power BI dashboard! Join us and learn how to:
• Design your BI model
• Acquire and transform data
• Turning data into valuable and interactive insights