Posts

Atlanta MS BI and Power BI Group Meeting on August 1st (Power BI Automation)

Please join us online for the next Atlanta MS BI and Power BI Group meeting on Monday, August 1st, at 6:30 PM ET.  We’ll have two presentations by 3Cloud. For more details and sign up, visit our group page.

Presentation:1.   “Power BI Meets Programmability – TOM, XMLA, and C#” by Kristyna Hughes

2.  “Automation Using Tabular Editor Advanced Scripting” by Tim Keeler

Date:August 1st
Time:6:30 – 8:30 PM ET
Place:Click here to join the meeting
Overview:Power BI Meets Programmability – TOM, XMLA, and C#

Tune in to learn how to programmatically add columns and measures to Power BI data models using TOM, XMLA, and C#! XMLA is a powerful tool available in the online Power BI service that allows report developers to connect to their data model and adjust a variety of entities outside the Power BI Desktop application. Combined with a .NET application, this can be a powerful tool in deploying changes to your Power BI data models programmatically.

Automation Using Tabular Editor Advanced Scripting

See examples of how advanced scripting in Tabular Editor can be used to automate the creation of DAX measures, calculation groups, and provide insights into your model while reducing development time and manual effort.

Speaker:Kristyna Hughes’s experience includes implementing and managing enterprise-level Power BI instance, training teams on reporting best practices, and building templates for scalable analytics. Currently, Kristina is a data & analytics consultant at 3Cloud and enjoy answering qualitative questions with quantitative answers. Check out my blog at https://dataonwheels.wordpress.com/ and connect on LinkedIn https://www.linkedin.com/in/kristyna-hughes-dataonwheels/

Tim Keeler is a data analytics professional with over 17 years of experience developing cost-to-serve models, business intelligence solutions, and managing teams of other data professionals to help organizations achieve their strategic objectives. Check my blog at https://www.linkedin.com/in/tim-keeler-32631912/

Prototypes without PizzaPower BI Latest

PowerBILogo

Atlanta MS BI and Power BI Group Meeting on July 11th (Pushing the Query Folding limits with Power Query)

Please join us online for the next Atlanta MS BI and Power BI Group meeting on Monday, July 11th, at 6:30 PM ET.  For more details and sign up, visit our group page.

Presentation:Pushing the Query Folding limits with Power Query
Date:July 11th
Time:6:30 – 8:30 PM ET
Place:Click here to join the meeting
Overview:One of Power Query’s most powerful features is its ability to translate the Power Query formula language (M) back to a source systems native language and in this session, we’ll push the limits and possibilities to avoid “breaking the fold” and explore some potential dark magic with List functions. A base understanding of T-SQL is helpful though not required for this session.
Speaker:From financial services to felines, the World Wide Web to professional wrestling – Alex Powers has an affinity for the conventional and unconventional when it comes to information. A self-proclaimed Excel and Power BI Enthusiast Alex Powers enjoys contributing to online forums and sharing his passion for empowering others using Microsoft technologies.
Prototypes without PizzaPower BI Latest

PowerBILogo

Power BI Dynamic M Query Parameters – Another Opportunity Missed for DirectQuery Users

UPDATE 17-Feb-2022: Dynamic query parameters now support popular relational data sources, and I posted an updated blog.

I had recently a Power BI advisory engagement for a large ISV. They had many customers. and each customer data was hosted in its own database for security reasons, with all databases having an identical schema. Power BI reports had to connect using DirectQuery to avoid refreshing data (real-time BI). Naturally, the customer envisioned a single set of reports with the ability to switch the dataset connection to the respective database depending on the user identity and company association. In addition, they wanted to piggyback on the existing database security policies by having each visual call a stored procedure and pass the user identity as a dynamic parameter.

Can Power BI do this? Unfortunately, no. The main architectural issue is that although the model (VertiPaq) and query (Power Query) are bundled in Power BI Desktop (and in a single dataset when published), they are like two separate universes. Naturally, this is not an issue when data is imported, but it becomes important with DirectQuery. As it stands, the only communication between these two layers is when Power Query passes the data back to the model. You can define query parameters, but they are static, meaning that they must be specified on the dataset settings page in Power BI Service. In other words, query parameter can’t reference DAX constructs, such as USERPRINCIPALNAME(), and therefore can’t reference runtime conditions.

That’s why I initially rejoiced when Microsoft announced Dynamic M Query Parameters, a feature that just went into public preview in the Power BI Desktop October 2020 release. Unfortunately, a better name of this feature would have been Kusto Dynamic Parameters since the primary design intent was to support Azure Data Explorer (internally named Kusto). It doesn’t apply to DirectQuery connections to most relational databases.

Although there is no indication, Power BI has two types of connectors: native and M-based. Native connectors target most popular relational data sources: TSQL (Azure Database, SQL Server, Synapse), PLSQL (Oracle), Teradata and relational SAP Hana. Dynamic query parameters won’t work with native connectors. The rest (Microsoft provided and custom) are M-based. If an M connector supports DirectQuery, it should support dynamic query parameters too. For example, besides Azure Data Explorer, other M-based data source that supports DirectQuery and therefore dynamic parameters are Amazon Redshift, Showflake, and Google BigQuery.

I hope Microsoft will revamp this feature to support the popular relational databases and DAX functions, so we can address more involved DirectQuery scenarios and make parameters really dynamics.

Power Query Merging on GUID Columns

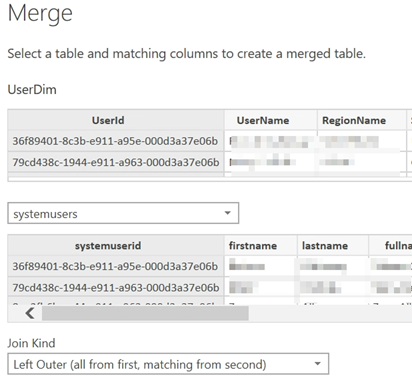
Scenario: You are merging two tables in Power Query on GUID columns with Text data type. In my case, the first table (UserDim) came from Azure SQL DB and the second (systemusers) from Dynamics CRM, but I believe the source is irrelevant. Then, you expand the second table in the next step after the merge, select the columns you need, and see expected results in the preview pane. However, when you apply the changes, the related columns are not populated (empty) in the Power BI data model. In other words, the join fails to find matches.

Solution: I think there is some sort of a bug in Power Query. True, Power Query is case-sensitive so joining on the same text that differs in casing in the two columns would fail the match. However, in this case the guids were all lower case (or at least that’s how they appear in the preview). The only way I could explain the issue is that the refresh somehow converts the guid values to different casing before the join is performed. Anyhow, the problem was solved by adding an explicit step to convert both guid columns to lower case before the merge step.

Conquering Time Zones

A client has Power BI models connected to Dynamics Online. Dynamics stores all dates in UTC instead of keeping the time offset, such as 7/14/2020 1:21:29 AM +00:00. Naturally, the users want to see dates localized to the US Eastern Time zone. Easy, right? Use the Power Query ToLocal time transformation (in the Transform ribbon, expand Time, and then click To Local) to offset with the desired number of hours. But there are a few issues with this approach:

  1. It will work fine in Power BI Desktop (assuming you are on the Eastern Time zone because Power BI will pick your computer settings), but it won’t work when you publish the dataset to powerbi.com. The reason for this is that Microsoft sets the time zone of Azure servers to UTC irrespective of the geo location of the Power BI data center. So, when Power BI Service refreshes the dataset, it will convert dates to its local time (UTC) and the net effect is that the date remains unchanged.
  2. You can attempt using the M DateTimeZone.SwitchZone function but for some obscure reason, casting the column data type to Date after the zone change puts the date back to UTC.
  3. The hour offset changes depending on when the country switches to Daylight Saving Time.

When the going gets though, the developer writes some code which in this case would be a Power Query ToTimeZone query function.

# open a Power Query blank query in Advanced Query mode and paste the code. Then rename the query to ToTimeZone
let
 Source = (UTCTime, TimeOffset) =>
let
 CurrentYear = Date.Year(DateTime.FixedLocalNow()),
 DST_Start = Date.StartOfWeek(#datetimezone(CurrentYear,3,14,0,0,0,TimeOffset,0),Day.Sunday) + #duration(0,2,0,0),
 DST_End = Date.StartOfWeek(#datetimezone(CurrentYear,11,7,0,0,0,TimeOffset+1,0),Day.Sunday) + #duration(0,2,0,0),
 OffsetTime = if UTCTime >= DST_Start and UTCTime < DST_End then TimeOffset + 1 else TimeOffset,
 #"Change Time" = if UTCTime=null then null else DateTimeZone.RemoveZone(UTCTime) + #duration(0, AdjustDST, 0, 0)
in
 #"Change Time"
in
 Source

The function takes two arguments: UTCTime and TimeOffset. For each row, the source query will pass the date as of datetimezone data type. The TimeOffset is the default time offset outside Daylight Saving Time. So, for US Eastern time zone, the time offset will be -5. Notice that I don’t specify types for the arguments because you may have empty (null) dates. If null is passed to UTCTime, you’ll get a runtime error. Instead, the last line checks if the incoming date is null. The function adjusts the time offset during Daylight Saving Time. Finally, it removes the time zone from the original date, so we get the date in a datetime format and then adds the offset. So, 7/14/2020 1:21:29 AM +00:00 will become 7/13/2020 9:21:29 PM.

Once the ToTimeZone function is ready, we can call it from the source query, like so:

let
 Source = OData.Feed("https://<tenant>.crm.dynamics.com/api/data/v9.1/appointments ", null, [Implementation="2.0"]),
 ToLocalTimeZone = Table.TransformColumns(Source, {{"createdon", each ToTimeZone(_, -5)}, {"scheduledstart", each ToTimeZone(_, -5)}}),
 #"Changed Type" = Table.TransformColumnTypes(ToLocalTimeZone,{{"createdon", type date}})
in
 #"Changed Type"

Notice that I use the TransformColumn transformation so that I can convert multiple date columns in one line and don’t end up with additional custom columns. In other words, I’m updating the date columns in place. Finally, I change the data type to date so that I can join to a Date dimension.

You can easily extend this code to handle times in multiple time zones, such as to report the time depending on the geo location of the user who entered the data. This will require storing the user time zone, such as in the Dynamics systemusers table.

T-SQL, Power Query, or DAX?

I taught my Applied Power BI class last week to a group of smart data analysts. All of them were knowledgeable of T-SQL, which they have been using extensively for years to shape and transform the data and produce SSRS, Qlik and now Power BI reports. They haven’t previously used Power Query, but they liked my overview of its features. However, they were rightfully confused when to use T-SQL, Power Query, or DAX. Starting with the data source and moving up the chain, Power BI lets you use expressions in:

  1. Data source (custom SQL Query, SQL view)
  2. Power Query
  3. DAX calculated columns
  4. DAX measures (the uppermost level)

My advice is to invest time and learn all these capabilities. When you have diverse skills, you can use the best tool for the task at hand.

Although is hard to generalize as every data transformation is different, I recommend you shape the data as upstream (closer to the data source) as possible. So, if you are familiar with T-SQL and that’s your primary data source, then use T-SQL. As one of the Microsoft best products, SQL Server has been enjoying 30 years of continuous improvements. Not only can you apply the skills you already have, but you will gain in performance when you use T-SQL and delegate data crunching to SQL Server which is what it’s designed to do. You can also benefit from the rich data manipulation features of T-SQL. These are the same reasons why I favor the ELT (Extract, Load and Transform) pattern in organizational BI solutions instead of SSIS data flow transforms. And if you find T-SQL lacking in features, Power Query can supplement it nicely, such as to fill down missing values, quickly unpivot data, or apply fuzzy lookup.

When you connect to data sources that don’t support SQL, such as flat files or Excel, the next natural place is Power Query to shape and transform the data. The choice between Power Query and DAX calculated columns is a tricky one and typically involves a compromise between performance and skill set. In many cases, you’ll find that a custom column can be implemented both in Power Query and DAX calculated columns. In general, if performance is OK, use Power Query, which is further upstream than DAX calculated columns. As a bonus, your data model will see the custom columns as regular columns and compress them equally well. Consider DAX calculated columns (one level up Power Query) when:

  • You must use DAX features that Power Query lacks, such as ranking.
  • When Power Query transforms lead to long data refresh times, such as a lookup between two large tables.

Finally, while custom columns can be often implemented in any of the first three layers, DAX measures are unique, and they typically can be implemented in DAX only. For example, if you need the expression to reflect the end user filter selection, you must use a DAX measure because only DAX measures are evaluated at run time and can access runtime conditions, such as values from filters and slicers.

Tableau Prep vs. Power Query

After a few years of extensive development and beta testing, Tableau announced its data preparation tool (Tableau Prep) for “redefining your data prep experience”. Previously, Tableau relied on other vendors, such as Alteryx, for self-service data preparation. Naturally, I wanted to take it for a spin and compare it with the Microsoft Power Query (available for free in Power BI Desktop and Excel), which has been around since January 2013. Power Query was initially introduced as an Excel add-on but now it’s available in both Excel and Power BI Desktop. For those of you pressed for time, here is the gist:

CriteriaPower QueryTableau Prep
PriceFree$70/user/month for Creator bundle
IntegrationIntegrated with Power BI and ExcelStand-alone (with preview in Tableau Desktop)
Prepackaged Connectors7026
Custom ConnectorsYesNo
Row-level transformationsKeep rows, remove rows, remove duplicates, promote headers, group by, merge, append, pivot, transpose, combine filesPivot, join, union
Column-level transformsCopy, remove, duplicate, column from example, calculated column, remove, remove duplicates, remove errors, change type, rename, transform (lower, upper, trim, etc.), replace values, replace errors, split column, index column, group by, fill, pivot, move, format, extract, number column (statistics, standard, scientific, math), date and time column, R scriptFilter (formula required), group and replace, clean (upper, lower, trim, remove characters), split, rename, remove, calculated field
Interactive graphical step flowNo (static Query Dependencies diagram)Yes
ParametersYesNo
Use R for data prepYesNo
User-created tablesYesNo
Detect and expand relationships in data sourceYesNo (one data source at the time)
Functions (to centralize common logic)YesNo
Script (all transformations in one place)YesNo
Calculation languagePower Query M languageTableau calculation language
Output destinationDirectly into PBI data model, Excel sheet (Power Query in Excel only)Save as TDE, Hyper, CSV, preview in Desktop
Output optionsOne table in the model per query (typically)One output from Tableau Prep file (Tableau model can’t handle multiple tables)

It’s clear that Tableau Prep is far behind the Power Query capabilities and has a lot of catching up to do. I took Tableau Prep for a quick ride to do simple data prep. The goal was to cleanse the geo table in the bi_dimensions Excel file that Microsoft provides as sample data for Dashboard in a Day (DIAD) workshops.

042618_2356_TableauPrep1.png

The geo table has a small (but common) issue because it has some extra rows that appear before the main dataset. These rows needs to be removed and the labels in the forth row needs to be promoted as column headers. Simple right?

042618_2356_TableauPrep2.png

In Power Query, you can quickly filter out top or bottom rows. No formulas or functions required. There wasn’t such a feature in Tableau Prep. I had to use a column filter (requires an expression) to filter out the top three rows. So much about “a drag-and-drop visual experience” and “no scripting required”. I also couldn’t find a feature to quickly promote column headers. In my opinion, Power Query is by far more user friendly than Tableau Prep.

After enough wrangling to do what’s simple in Power Query but complicated in Tableau Prep, I wanted to save the results. In Power BI Desktop and Excel, you can conveniently load the transformed data directly into the data model. Then, to reflect the changes in the data source, such as when you get a new file with the same spec, you just refresh to re-import and transform the data. No such integration with Tableau Prep. It’s designed to run the flow manually. And to me the biggest limitation of the tool, which stems from the limitation in the Tableau modeling capabilities, is that everything falls apart when you need multiple tables in your data model. Tableau’s mentality remains “one dataset at the time”.

I’ve noticed people excited about the Tableau Prep graphical interface. While it does help visualizing the flow I’m not sure how much value it really adds given that the steps are sequential, and the tool doesn’t support conditional constraints and branches. But you have pretty icons…without much behind.

While testing the tool, I couldn’t help but ask myself “Why pay hundreds of dollars per user/per year for Tableau Creator when Power BI Desktop is better and free?”

I shared more thoughts about Tableau vs Power BI in my blogs Power BI vs. Tableau (Part 1), Power BI vs. Tableau (Part 2), Power BI vs. Tableau (Part 3), and Tableau Hyper vs. Power BI xVelocity. As usual, I welcome your comments. Tableau fans are welcome too.

Configuring Power Query OData Feeds

Scenario: A customer has implemented a Power BI model that retrieves data by calling the Dynamics CRM OData Feed endpoint. The dataset refresh operation is timing out. They want to increase the timeout setting but unlike connecting to SQL Server, where you can set the timeout duration in the source advanced properties, there is no UI for ODATA.

Solution: If you open the query behind the table, and click the Source step, you’ll see in the Query Editor formula bar the following M code:

= OData.Feed(“https://<tenant>.api.crm.dynamics.com/api/data/v8.1/”)

From the documentation, we realize that OData.Feed can take additional settings and one of them is the Timeout setting that you can pass to the third options argument. For example, you can change the M code to set the timeout to 1 hour:

= OData.Feed(“https://<tenant>.api.crm.dynamics.com/api/data/v8.1/”, null, [Timeout=#duration(0,1,0,0)])

The timeout uses the duration data type which is explained here. Bringing this one step further, you can restrict what records get pulled in the OData.Feed using $filter and also only grab data for the columns you’re using by including the field names in the $select parameters, e.g.

“https://<tenant>.crm.dynamics.com/api/data/v8.1/leads?$filter=<somefield> eq 740110001&$select= <removed list of fields>”