Continuing the line of thought from my previous blog “Microsoft Unveils BI Roadmap”, one nagging question still remains. What to do with all these Excel files now that SSRS came with a vengeance and has been promoted to THE on-premises BI platform? It looks like Microsoft is thinking along these lines. Interestingly, Excel Services will be removed from SharePoint Server 2016 and replaced with Office Online Server, as explained here. And this page gives more details about Office Online Server which is currently in preview. In a nutshell, Excel rendering would work pretty much in the same way as in SharePoint Server 2013. The most common scenario that Microsoft plans now is to have the Excel workbook in SharePoint. When you open the workbook, SharePoint will redirect you to the Office Online Server using a WOPI frame (some sort of an Iframe), with some special tokens that enable Office Online Server to retrieve the workbook from SharePoint, and then render it as usual. This will work for Power Pivot models as well. Office Online Server (OOS) also supports loading Excel files from OneDrive which is how Power BI Excel rendering works today.
But wouldn’t be nice to extend SSRS 2016 and integrate with OOS so that you can deploy Excel reports to a report server installed in native mode? This would allow SSRS to handle all of the important Microsoft report formats (SSRS, Datazen, Power BI Desktop, and Excel). If OOS doesn’t require a SharePoint license, this will be a great value proposition as well as you will save you a SharePoint Server Enterprise Edition license. This is precisely the wish I communicated to Microsoft and posted it on the Excel wish list. Please vote if you like the idea.
You know that there is an Excel wish list site, right?
A prerequisite for creating a relationship in Tabular/Power Pivot is to have a primary key column in the table on the One side of the relationship. This column must have unique values. If it doesn’t, the relationship won’t get created and you’ll get an error that the both tables have duplicate keys. If you have a relatively large table, it might be difficult to find the duplicates.
ID
Column1
1
Foo
2
Foo
1
Foo
However, given the above table design, you can add a simple calculated column to the table to return the count of duplicates for column ID using the following DAX formula
This expression uses the COUNTROWS() function to count the number of rows of Table1. Coupled with the CALCULATE function, this expression will be resolved in the context of every row. To ignore the column that you want to count on (ID in this case), you need to exclude it from the context, so that the row counting happens across the entire table for each ID value. Once the column is created, you can filter on it in the Data View to find out the duplicate rows with values 2, 3, etc.
One of the biggest strengths of Microsoft self-service BI is the ability to create sophisticated data models on a par with organizational BI models built by professionals. This fact is often overlooked when organizations evaluate self-service tools and the decision is often made based on other factors but not insightful understanding of the data model capabilities. This is unfortunate because most popular tools on the market don’t go much further than supporting a single dataset. By contrast, Power Pivot allows you to import easily multiple datasets from virtually anywhere and join the resulting tables as you can do in Microsoft Access. This brings tremendous flexibility and analytical power.
Unlike multidimensional cubes, one of the limitations of the Power Pivot and Tabular data models has been the lack of support for declarative many-to-many relationships. The workaround has been using a simple DAX formula to resolve the relationship over a bridge table, such as =CALCULATE (SUM (Table[Column] ), <BridgeTable>) but this approach might present maintenance issues, as you have to create multiple calculated measures to support different slicing and dicing needs. However, as pointed out in my latest newsletter, the upcoming version of Power BI aims to remove adoption barriers and adds new features. And, one of this features, is bidirectional relationships and declarative support of M2M relationship, which Chris Webb already wrote about.
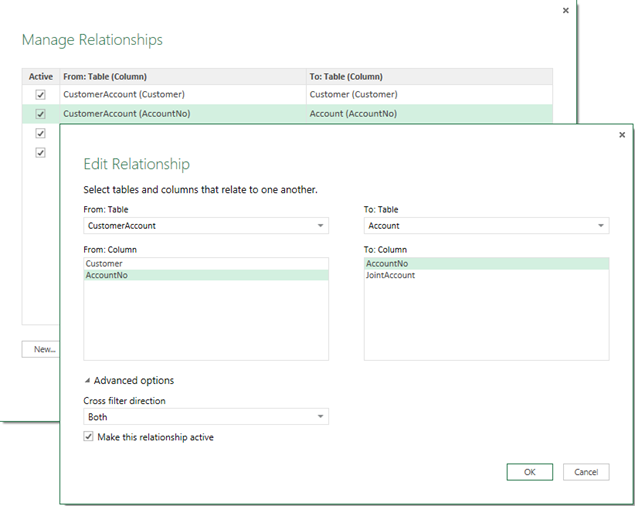
To test the M2M relationship, I attempted to create the same M2M scenario that I used in my book, which models a joint bank account. The corresponding Power Pivot schema is shown below. The CustomerAccount table is the bridge table that resolves the M2M relationship (a customer might have many accounts and a bank account might be shared by multiple customers). The Balances table stores the account balances over time and the Date table lets us analyze these balances over time.
Setting up a M2M relationship in the Power BI Designer is achieved by changing the “Cross filter direction” relationship setting to Both. This setting and bi-directional relationships are described in more details here.
Indeed, creating a report that shows balances by customer resolves the M2M relationship and aggregates correctly.
Unfortunately, attempting to slice the report by Date returns an error in the preview version of the Power BI Designer so the M2M feature is still a work in progress. Brining this further, a useful addition could be declarative semi-additive functions to allow the user to set the aggregation behavior of the Balance measure, such as to LastNonEmpty. Similar to Multidimensional, this will avoid the need for user-defined explicit measures.
https://prologika.com/wp-content/uploads/2016/01/logo.png00Prologika - Teo Lachevhttps://prologika.com/wp-content/uploads/2016/01/logo.pngPrologika - Teo Lachev2015-01-04 19:03:002021-02-16 04:58:58Tabular M2M Relationships on the Horizon
Scenario: You have created an SSRS application in SharePoint and specified that the application pool would use a specific domain service account that is designated to SSRS. When you attempt to create a Power View report from a deployed Power Pivot model, you get the following error:
An error occurred while loading the model for the item or data source ‘<path to Excel file>’. Verify that the connection information is correct and that you have permissions to access the data source.
Resolution: The most important information is the message “SetAuthContext need to be run as sysadmin“. This tells us that the SSRS account doesn’t have admin access to the SSAS instance configured in SharePoint mode. Another way to confirm this is to run the SQL Profiler connected to the SSAS instance, e.g. SERVER\POWERPIVOT, and attempt to create a Power View report. You would see the same error message in the Profiler.
How do we fix this horrible issue? Connect to the SSAS instance in SSMS, right-click on the server node and then click Security. Then, add the SSRS account to the list to grant it admin rights to SSAS. This is something SharePoint should have done during the setup of the SSRS application since the SharePoint farm account has admin rights to the SSAS instance but apparently this step has been omitted.
In the process of configuring Power Pivot for SharePoint, you need to run the Power Pivot Configuration Tool, which the documentation explains well here and here. What it doesn’t tell you is that unless you overwrite the URL in the Activate PowerPivot Feature in a Site Collection step, Power Pivot will be activated for the first site collection. I ran into a situation where the customer had installed My Sites and Portal site collections and the tool happily defaulted to activating Power Pivot for the My Sites site collection although we expected it to show up in the portal site.
Ideally, the tool should support checking multiple site collections but it doesn’t – you can specify only one. And if you don’t overwrite the URL, it will pick the first site collection it finds. If your SharePoint farm has other collections, you need to manually activate Power Pivot after the Power Pivot Configuration Tool is done. You can activate Power Pivot for additional site collections as follows:
On a SharePoint site, click Site Actions. Click Site Settings.
In Site Collection Administration, click Site Collection features.
Scroll down the page until you find PowerPivot Integration Site Collection Feature, and then click Activate.
https://prologika.com/wp-content/uploads/2016/01/logo.png00Prologika - Teo Lachevhttps://prologika.com/wp-content/uploads/2016/01/logo.pngPrologika - Teo Lachev2014-06-30 02:16:102021-02-16 04:29:58Where is Power Pivot for SharePoint?
The Power Pivot update story is somewhat convoluted. Excel 2013 integrates Power Pivot natively and the only way to get it updated (assuming the traditional MSI installation option) is through Office updates because the Office team now owns its distribution. Alternatively, if you have an Office 365 subscription, and have installed Office 2013 via the click-to-run option, then the Office and Power Pivot updates will be pushed to you automatically.
With Excel 2010, Power Pivot is an external add-in that can be updated from the Microsoft download center. While the Excel 2013 Power Pivot bits are installed in the %Program Files%\Microsoft Office\Office15\ADDINS\PowerPivot Excel Add-in, the Excel 2010 Power Pivot add-in is installed in a different location: %Program Files%\Microsoft Analysis Services\AS Excel Client\110.
The interesting side effect is that the Excel 2010 Power Pivot can be updated more frequently (for example, every time there is a SQL Server 2012 service pack or cumulative update), while Excel 2013 MSI users must wait for an office update (distributed via Windows Update for MSI installer) or via O365 updates.
To make the whole story short:
If you have Excel 2010, use the latest Power Pivot bits available on the Microsoft Download Center.
If you have both Excel 2010 and 2013, use the Microsoft Download center to get Excel 2010 updated. Excel 2013 won’t.
If you have Excel 2013 only, wait for Office updates.
https://prologika.com/wp-content/uploads/2016/01/logo.png00Prologika - Teo Lachevhttps://prologika.com/wp-content/uploads/2016/01/logo.pngPrologika - Teo Lachev2014-04-14 01:27:002016-02-15 07:28:12The Power Pivot Update Story
The self-service BI journey starts with the business user importing data. With Microsoft Power Pivot, we encourage the user to import tables and create relationships among these tables, similar to what they would do with Microsoft Access. This brings tremendous flexibility because it allows the user to incrementally add new datasets and implement sophisticated models for consolidated reporting, such as for analyzing reseller and internet sales side by side. True, Power Pivot relationships have limitations, including:
The lookup table must have a primary key and the relationship must be established using this key. As it stands, Power Pivot doesn’t support multi-grain relationship where the fact table joins the lookup table at a higher grain than the primary key.
Many-to-many relationships (such as a joint bank account) are not natively supported and currently require simple DAX formulas to resolve the relationship, such as CALCULATE ( SUM ( Table[Column] ), BridgeTable)
Closed loop relationships (Customer->Sales->Orders->Customer) are not allowed, etc.
The chances that these constraints will be relaxed in time as Power Pivot and Tabular evolve to allow you to meet even more involved requirements on a par with organizational BI models.
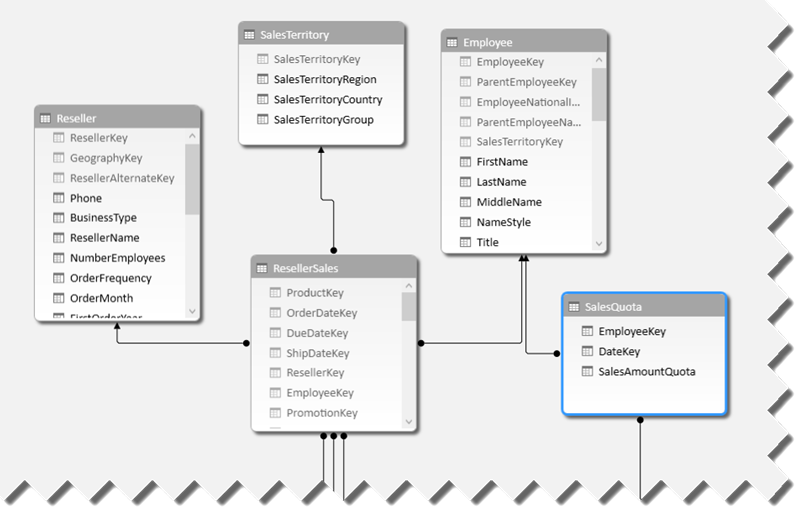
With the recent popularity of other tools for self-service BI tools, I took a closer look at their data features. Tableau, for example, encourages users to work with a single dataset. If the user wants to import data from multiple tables, the user must create table joins to relate the tables before data is imported in order to create a dataset that has all the required data. This probably meets 80% of self-service BI requirements out there although it might preclude consolidated analysis. Suppose you want to analyze reseller sales by customer. With Tableau, you need to join the Customer and ResellerSales tables in order to prepare the dataset and that’s probably OK to meet this requirement. At some point, however, suppose you need to bring also Internet sales which are stored in a separate table. Now you have an issue. If you opt to change the dataset and join the Customer, ResellerSales, and InternetSales, you’ll end up with duplicated data because you can’t join ResellerSales to InternetSales (they don’t have a common field). In Power Pivot, you could simply address this by importing Customers, ResellerSales, and InternetSales as separate tables and creating two relationships Customer->ResellerSales and Customer->InternetSales. Notice that a Power Pivot relationship happens after the tables are imported although it’s possible of course to establish a data source join during the data import. A Tableau workaround for the above scenario would be to go for “data blending”. Speaking of which…
It’s also interesting how Tableau addresses combining data from separate data sources. Referred to as “data blending”, this scenario requires the user to designate one of the data sources as primary and specifying matching fields from the two data sources to perform the join. Behind the scenes, Tableau executes a post-aggregate join that aggregates data at the required grain. Let’s say, you import the Customer table from Data Source A and InternetSales table from Data Source B. Suppose that both the Customer and InternetSales datasets have a State field which you want to use for the join. With data blending, Tableau will first aggregate the InternetSales dataset at the State level (think of SUM(SALES) FROM … GROUP by STATE) and then join this dataset to the Customer dataset on the State field. The advantage of this approach is that you can join any two datasets as long as they have a common field (there is no need for a primary key in the Customer table). The disadvantage is that the secondary data source can’t be joined to another (third) data source. Further, this approach precludes more complicated data entity relationships, such as many-to-many.
When choosing a self-service BI tool, you need to carefully evaluate features and one of the most important criteria is the tool data capabilities. Some tools are designed for one-off analysis on top of a single dataset and might require importing the same data to meet different reporting requirements. Power Pivot gives you more flexibility but requires end users to know more about data modeling, tables and relationships.
https://prologika.com/wp-content/uploads/2016/01/logo.png00Prologika - Teo Lachevhttps://prologika.com/wp-content/uploads/2016/01/logo.pngPrologika - Teo Lachev2014-03-30 19:52:002016-02-15 07:41:39Data Models for Self-Service BI
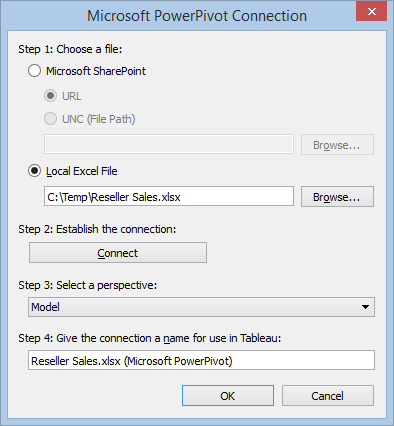
Now that Tableau has been highly praised by Gartner, you might be looking for ways to make the best of both self-service BI tools: the great data modelling capabilities and programming richness of Power Pivot and the visualization strengths of Tableau. Interestingly, besides published to SharePoint Power Pivot workbooks, Tableau can connect to local Power Pivot models and send MDX queries (as it does when connected to Multidimensional and Tabular).
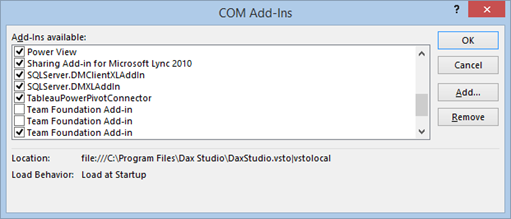
This works thanks to the Tableau PowerPivot Connector wrapper (Microsoft SQL Server 2012 PowerPivot for Excel) that you can install from the Tableau website. Read this document to decide which one to use.
https://prologika.com/wp-content/uploads/2016/01/logo.png00Prologika - Teo Lachevhttps://prologika.com/wp-content/uploads/2016/01/logo.pngPrologika - Teo Lachev2014-02-24 20:06:002021-02-16 04:29:48Analyzing Power Pivot Models with Tableau
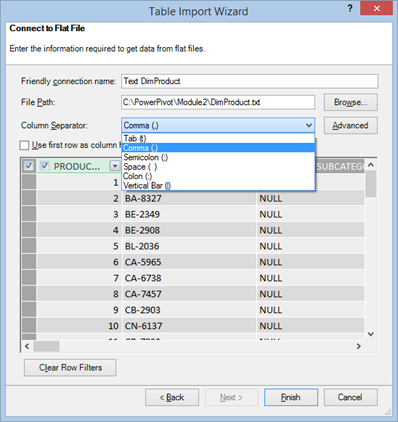
Power Pivot (and Tabular) uses the Access Connectivity Engine (ACE) provider to import from text files. This provider was originally designed for Microsoft Access databases and it’s limited to import files no larger than 2 GB (or 4 GB with the Office cumulative update from April 2012) as explained here. The Power Pivot Table Import Wizard allows you to import from delimited files and only a subset of delimiters are available for you to choose from.
However, the ACE provider supports a SCHEMA.INI file that can describe other formats, such as fixed-length files, or delimited files that use other delimiters, such as a double-pipe character “||”. If a SCHEMA.INI file exists in the same folder where the source file is located, Power Pivot will use the file.
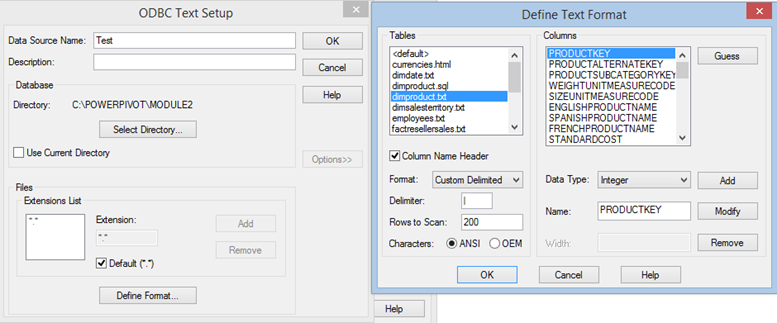
Generating the schema file can be tedious, especially if the source file has many columns. However, the ODBC Data Source Administrator tool can auto-generate the file for you.
Open ODBC Data Source Administrator (32 or 64 bit) and click Add.
In the Create New Data Source, select the Microsoft Text Driver.
Click Finish. In the ODBC Text Setup, specify the folder where the source file that you want to import from is located.
Click the Define Format button.
The tool is capable of interfering the format by clicking the Guess button.
Once you click OK, the tool generates the schema.ini file in the same folder where the source file is located.
For some obscure reason that this support article refers to, you might get an error “Failed to save table attributes of (null) into (null)” but the schema.ini file will be still generated.
I’ve start seeing customers moving to or considering Office 2013 for self-service BI. Naturally, the end users would like to share their Excel 2013 self-service data models by deploying to SharePoint. Does SharePoint 2010 support this scenario? Unfortunately not. The user can upload Excel 2013 files and view the embedded reports. However, when he attempts to perform an interactive action (triggers all backend services involved in processing Power Pivot workbooks) he gets the dreaded error “Unable to refresh data for a data connection in the workbook”. What’s wrong in this case is that due to the Excel 2013 changes to support Power Pivot natively, Excel Services must load the data model in a different way. This is discussed in more details in the “‘Unable to refresh data for a data connection in the workbook’ error when you interact with an Excel 2013 workbook in a SharePoint Server 2010 farm” article by Microsoft. Note that the only resolution path is to upgrade to Share Point 2013.
Again, the issue is with Excel Services and not with the Power Pivot version. If the user has Excel 2010 with the latest Power Pivot bits (SQL Server 2012 SP1 version of Power Pivot), then the SharePoint 2010 integration works. To make the upgrade story short:
Match SharePoint version with the Office edition. If you need to support Excel 2013 Power Pivot workbooks, upgrade to SharePoint 2013.
The SQL Server instance behind Power Pivot for SharePoint must match the Power Pivot version on the client. For example, if the users have Excel 2010 with the SQL Server 2012 SP1 version of Power Pivot, the SQL Server instance installed on the SharePoint server should be SQL Server 2012 SP1. SQL Server 2008 R2 won’t be able to handle the latest Power Pivot bits.
This is definitely something to watch and plan for when considering upgrading to Office 2013.
https://prologika.com/wp-content/uploads/2016/01/logo.png00Prologika - Teo Lachevhttps://prologika.com/wp-content/uploads/2016/01/logo.pngPrologika - Teo Lachev2013-12-07 18:23:292021-02-16 04:29:33SharePoint 2010 and Excel 2013 Power Pivot