Posts

The SharePoint 2013 Data Model

Somehow, this PowerPivot for SharePoint gem escaped my attention but it’s a very important deployment enhancement that was more than likely initiated by Power BI and the cloud. Starting with SQL Server 2012 Service Pack 1 and SharePoint 2013, you can set up a dedicated SSAS server in SharePoint mode outside the SharePoint farm and configure the farm to point to it. This was possible as a result of all the integration work done between Excel Calculation Services, SharePoint and AS for the 2013 release. Previously, the SSAS in SharePoint configuration mode instance had to be installed on the SharePoint application server.

This brings more flexibility to scaling out your PowerPivot environment outside SharePoint and simplifies the PowerPivot setup. For example, to scale out Analysis Services, you can simply add a new SSAS server configured in SharePoint mode. Excel Calculation Services will balance the load between all available SSAS servers automatically based on health statistics obtained from these server instances. Same thing if you want to make the backend fault-tolerant. If one server goes down, the workbooks that used to be on the failed server will automatically get redeployed on the others by Excel Calculation Services. Specifically, the next time the workbook is accessed by a user, ECS would realize that the workbook is no longer on any active node and the workbook would get loaded once again on a different node.

To register a new server in SharePoint 2013:

  1. Open the SharePoint Central Administration, in the Application Management section, click Manage service applications.
  2. On the Manage Service Applications page, click the Excel Services service application that you want to manage.
  3. On the Manage Excel Services page, click Data Model.

102713_0124_TheSharePoi1

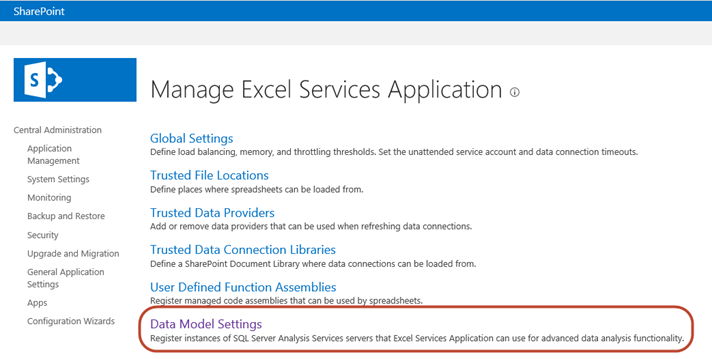
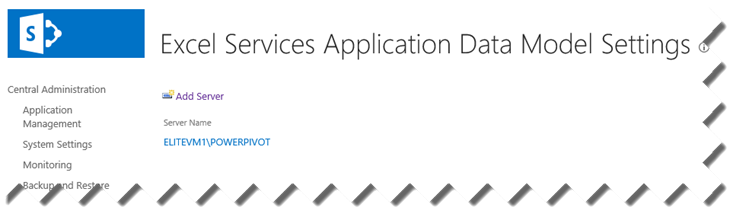
Then, in the Excel Services Application Data Model Settings, click Add Server to register the new server.

102713_0124_TheSharePoi2

The PowerPivot setup is simplified as well because you don’t need to install the PowerPivot for SharePoint add-in, as explained here. However, the add-in is still required for the PowerPivot for SharePoint full capabilities, including PowerPivot Gallery, scheduled data refresh, and the PowerPivot management dashboard. Finally, having a dedicated SSAS server might save you money if you need to scale out. That’s because you no longer need to license SSAS on each SharePoint application server assuming you don’t need the other SQL Server components, such as SSRS. Further savings can be realized by deploying SSAS in SharePoint as another instance to an existing SSAS server (Multidimensional or Tabular) you have. To my understanding, the same version instances are covered by a single license.

Refreshing Excel File in PowerPivot from SharePoint

A couple of SharePoint-related questions from students taking my PowerPivot class that are worth sharing.

Question: Can I import data from and auto-refresh an Excel file deployed to a SharePoint library in PowerPivot?

Answer: Yes, if you use WebDAV and specify the UNC path to the file. WebDAV requires the Windows Server Desktop Experience feature to be installed and the WebClient service to be started:

081013_1851_RefreshingE1

Question: If major and minor (draft) versioning is enabled in the PowerPivot Gallery, is there a way to configure PowerPivot to create major versions only on refresh instead of minor versions?

Answer: This is not supported natively by PowerPivot because the snapshot process is not configurable. A possible workaround is to configure a SharePoint workflow to promote minor versions to major versions. As a side note, you should be careful with maintaining version history because the SharePoint content database will quickly grow. If you haven’t done so, consider configuring SharePoint to retain a limited number of versions.

PowerPivot Data Refresh in Excel 2013

What options does a PowerPivot user have to refresh data in a PowerPivot model on the desktop, aka PowerPivot for Excel?

Prior to Excel 2013, the answer was just one – manual refresh by either clicking the Refresh button in the PowerPivot window or the Refresh button in the Existing Connections dialog box. Note that the Refresh button in the Excel ribbon doesn’t work since Excel doesn’t know anything about PowerPivot. Not does the checking the “Refresh data when opening the file” checkbox in the PowerPivot connection. In Excel 2010, these options won’t reopen the PowerPivot connections to the data sources. Instead, the net effect is that they will simply refresh the pivot reports from the pivot cache which is not what you’re after.

Starting with Excel 2013, however, Excel and PowerPivot play better together as I discussed in my What’s New in Office 2013 BI blog. And, now we have additional options to refresh data:

  1. Right-click the pivot report, go to PivotTable Options, click the Data tab, and then click “Refresh data when opening the file”. Enabling this option will refresh the data in the PowerPivot tables that are used on the report when you re-open the Excel workbook file.
  2. In the Excel Data ribbon, click Connections, select the connection you want to refresh, and then click Properties. Notice that all PowerPivot connections are now exposed in the Connections dialog. In the Connections Properties dialog box, check the “Refresh data when opening the file”. This option will open the connection when you open the file, and refresh all PowerPivot tables using the connection.

020413_1400_PowerPivotD1

3.    Finally, you can also automate PowerPivot tasks, including refreshing data. For example, if you want to refresh the ResellerSales table on open, you can add the following line to the Workbook_Open() event:

ActiveWorkbook.Model.ModelTables(“ResellerSales”).Refresh

Speaking of automation, everything you can do in the Excel UI is exposed in the object model and automatable in Excel 2013. Here is another example of adding a table from the Excel workbook to the model and then creating a relationship between that table and another table which is already in the model:

Workbooks(“Book1”).Connections.Add “WorksheetConnection_Book1!Table2”, “”, “WORKSHEET;Book1”, “Book1!Table2”, 7, True, False

ActiveWorkbook.Model.ModelRelationships.Add ActiveWorkbook.Model.ModelTables(“Table1”).ModelTableColumns(“Name”), ActiveWorkbook.Model.ModelTables(“Table2”).ModelTableColumns(“Name”)

And, don’t forget then when you deploy your PowerPivot model to SharePoint you can automate the data refresh on a schedule.

Is Excel Calculation Services Needed on a PowerPivot for SharePoint Application Server?

Scenario: A SharePoint 2010 scale-out farm with two application servers:

APP1 – Runs Excel Calculation Services (ECS)

APP2 – Runs PowerPivot for SharePoint (R2 or 2010)

Do you need to start ECS on APP2 in order for PowerPivot for SharePoint to work?

Answer: You don’t but if you don’t have the updated Analysis Services OLE DB Provider on APP01, you’ll get the dreaded “Failed to create new connection…” error when you browse the PowerPivot workbook. SharePoint ships with the SQL 2008 ADO MD, MSOLAP, etc. stack; not the R2 or later components. Therefore, you must upgrade the OLE DB provider (R2 or 2010 depending on the PowerPivot version) as explained in the How to: Install the Analysis Services OLE DB Provider on an Excel Services Computer topic in Books Online.

Thanks to Dave Wickert for clarifying this.

Finding Source Column Names in PowerPivot

Question: How do I find the source column name in PowerPivot if I’ve renamed and moved columns around?

Answer: Assuming that the table doesn’t use a custom query to import data or it wasn’t derived from an Excel linked table or Windows Clipboard, you can use the table properties to find the source column name as follows:

  1. In the PowerPivot Window, click the table to select it.
  2. In the Design ribbon tab, click Table Properties.
  3. Make sure that the Column Names From radio button is set to Source.

032812_1329_FindSourceC1

Presenting Personal BI with PowerPivot v2

022312_1752_PresentingP1I’ll be presenting “Personal BI with PowerPivot v2” for the Atlanta BI Group on Monday, February 27th. Join us to learn when personal BI makes sense and why PowerPivot is the best tool on the market when it does. The focus will be on the new features of PowerPivot version 2 which launch officially in a week or so.

For more information and to register visit our Atlanta BI home page.


Online PowerPivot Class

I am teaching my online Applied PowerPivot class for personal and team business intelligence on Jan 24th and 25th and there are still seats available.

PowerPivot for Excel SQL Server 2012 RC0 is Here

Microsoft just published the RC0 (release candidate) bits of PowerPivot for Excel SQL Server 2012. Kudos for Microsoft for making the RC bits public this time. Stay tuned for an announcement for the arrival of the SQL Server 2012 RC bits soon. The RC build is a feature-complete and stable build. This will be the last pre-release build until SQL Server 2012 officially ships next year.

Here are all SQL Server 2012 RC0 links pulished so far:

Microsoft SQL Server 2012 Express RC0

Microsoft SQL Server 2012 Semantic Language Statistics RC0

Microsoft SQL Server 2012 Master Data Service Add-in for Microsoft Excel 2010

Microsoft SQL server 2012 Manageability Tool Kit RC0

Handling Dates in BISM Tabular

[View:https://prologika.com/CS/cfs-file.ashx/__key/CommunityServer.Blogs.Components.WeblogFiles/blog/2308.AdventureWorks.zip:550:0]If you have experience with multidimensional cubes, you know that most cubes have a Date dimension grained at a day level. If the fact table has multiple date keys, you can join the Date dimension multiple times to the measure group so the Date dimension can play multiple roles (a role-playing dimension), such as OrderDate, ShipDate, and DueDate. If you use Excel pivot reports connected to the cube, to get support for dates you need to make the following changes as explained in Designing SQL Server 2005 Analysis Services Cubes for Excel 2007 PivotTables:

  1. Set the Type property of the Date dimension to Time. This is also required for MDX time-related functions, such as YTD.
  2. Set the ValueColumn column of the Date key to a column of date data type.

Once this is done, Excel “understands” the date semantics and treats dates as dates when you sort and filter on any field from the Date dimension. It also shows a nice menu for time calculations (relative dates).

103011_2341_HandlingDat1

But what if another dimension has a date attribute, such as the customer’s birth date? Unfortunately, Excel won’t recognize this field as of date type and it will treat as text. Not good, but these are the limitations of Excel OLAP pivot reports.

How does BISM Tabular change things as far handling dates? Starting with SQL Server 2012 and PowerPivot version 2, you can mark a table as a Date table. In the process of doing so, you need to specify a unique identifier. Once this is done, you get the same support for dates with Excel pivot reports because they are actually OLAP pivot reports that see BISM Tabular models as cubes. Specifically, Excel will treat only fields from the Date table as dates. Take for example the following model (attached in the blog):

103011_2341_HandlingDat2

The Orders table has three date fields (OrderDate, DueDate, and ShipDate). In SQL Server 2012, BISM Tabular and PowerPivot support multiple joins between tables, as Kasper de Jonge explains in his PowerPivot Denali: Working with multiple relationships between two tables blog. Well, kind of, because only one join can be active (the one in the solid line). The other dotted relationships can be used for DAX calculations, such as SalesAmountByDueDate, SalesAmountByShipDate, etc. In other words, BISM Tabular doesn’t support true role-playing tables and you won’t get automatically DueDate and ShipDate instances of the Date table. You can import the Date table multiple times but only one table can be marked as a Date table. However, Power View (code-named Crescent) is designed from ground up to support natively BISM Tabular models. Consequently, the Excel date limitations disappear, as shown in the table below.

Date FeaturesExcelPower View
Date typesOnly in Date tableAll tables
Relative DatesOnly in Date tableN/A


Power View treats any Date field as a date. For example, this Power View report shows the OrderDate and TaxAmt fields from the Order table. The OrderDate field is of date data type. As you can see, I can filter on dates after a given date and Power View shows the correct results. Unfortunately, Power View doesn’t support relative dates as Excel does so you must define DAX time calculations.

103011_2341_HandlingDat3

In short, here are some recommendations to get the most of dates:

  1. If you need to support multiple dates, leave the columns as a of date data type. Don’t use integer keys or smart keys, which are a common practice in data warehousing, to join to the Date table.
  2. Have a Date table that joins to the date that is mostly commonly used so users can aggregate by quarters, years, etc. Make sure that the date columns in the other tables don’t include times because you won’t be able to join 10/19/2011 8:40 PM to 10/19/2011. If you need to have the same support for the other dates, reimport the Date table multiple times.
  3. Consider creating inactive relationships for the other dates to be able to implement DAX calculations.
  4. Use Power View for reporting. Besides better handling of dates, Power View will give you better performance with transactional reporting, as I explained in my Transactional Reporting with BISM Tabular blog.

BTW, speaking of dates and BISM Tabular, Boyan Penev (MVP SQL Server) has implemented a nice Date Stream feed on Azure Data Market. If you decide to consume the feed, you would notice that the DateKey column is returned as ISO8601 date (such as 2011-10-29T00:00:00. Unfortunately, Excel doesn’t recognize the ISO8601 format. You might think that you can around this predicament by creating a calculated column that removes the time portion but you can use a calculated column as a unique identifier in the Date table. As a workaround, save the feed as a file and strip out the time portion so you can set the data type to Date.

CTP3 Issues with PowerPivot Management Dashboard

I ran into a couple of snags with the PowerPivot Management Dashboard and CTP3 of Denali. In this case, I’ve installed PowerPivot for SharePoint on a standalone domain controller.

  1. The Actions web part of the PowerPivot Management Dashboard refuses to load with the following exception logged in the SharePoint URL log ” Unable to acquire information about the NT group ‘Enterprise Admins'”
    Resolution: This is a known issue that will be fixed in RTM. The workaround is to (1) delete any accounts that display their SIDs, i.e. they were part of a domain that is no longer valid, and (2) to delete any universal or enterprise groups
    Connect item: https://connect.microsoft.com/SQLServer/feedback/details/685945/system-exception-unable-to-acquire-information-about-the-nt-group-enterprise-admins
  2. The dashboard doesn’t display any data although usage data is collected. This is caused by the fact that the PowerPivot system account doesn’t have rights to the PowerPivot SQL database and the timer job fails. The SQL Profiler shows the following error “The SELECT permission was denied on the object ‘vHealth’, database ‘DefaultPowerPivotServiceApplicationDB’, schema ‘Usage’. An error occurred while processing the ‘Health’ table.”
    Resolution: Grant the PowerPivot system account rights to all tables and views in the PowerPivot database
    Connect item: https://connect.microsoft.com/SQLServer/feedback/details/685955/no-data-in-powerpivot-management-dashboard-due-to-insufficient-rights