I had to download many ASP.NET pages from the SharePoint Pages library that were used to wrap up the Reporting Services ReportViewer webpart. I wanted the pages as files, so I could deploy them to another SharePoint server. Unfortunately, SharePoint doesn’t support selecting and downloading multiple files. But, it does support the WebDAV protocol.
Open Windows Explorer and type in the following URL: \\<SharePoint site>\<library>
Example: \\elitex\Pages, where elitex is the SharePoint server and Pages is the document library.
Windows Explorer shows all documents in the library. From there on, just copy the files you need to another folder.
The only caveat is that you need to make sure the WebClient Windows service is running on your laptop. If you’re trying to connect from Windows 2008 Server, then make sure the Desktop Experience role is installed as well, which installs that WebClient service.
https://prologika.com/wp-content/uploads/2016/01/logo.png00Prologika - Teo Lachevhttps://prologika.com/wp-content/uploads/2016/01/logo.pngPrologika - Teo Lachev2012-01-19 15:06:572021-02-16 03:48:49Downloading Multiple Files from SharePoint using WebDav
Issue: Migrate a PerformancePoint dashboard from MOSS 2007 to SharePoint 2010. We used the Import PerformancePoint Content feature to import existing dashboards from the PerformancePoint database and this saved us a lot of effort. However, filters failed with this rather obscure error:
After tracing with SQL Profiler and looking at the Windows Event log, we saw the following almost as useless error):
Microsoft.AnalysisServices.AdomdClient.AdomdErrorResponseException: Query (1, 7) Parser: The syntax for ‘{‘ is incorrect.
In this case, the dashboard is using a Time Intelligence filter mapped to an Analysis Services dimension.
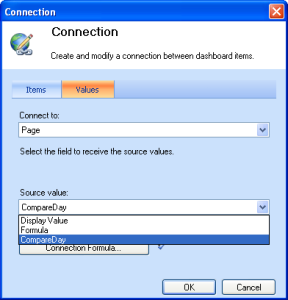
Resolution: The upgrade process has mapped the filter’s formula in the connection to the scorecard. We fixed the issue by mapping the filter data source (not formula), as shown in the screenshot below. In this case, the CompareDay is the data source name.
Well, rules have changed. As Jaime Tarquino from the SSRS team explained in his blog, “SQL Server 2012 Reporting Services SharePoint Integrated Mode”, there is no rsreportserver.config file anymore moving to Reporting Services 2012 in SharePoint integration mode (there are no configuration changes with native mode). Instead, the configurations sections are now saved in the SharePoint configuration database.
Problem: A customer plans to upgrade to SQL Server 2012 and SharePoint integration mode. They had the following custom renderer registered in the rsreportserver.config file that uses device information settings to customize the Excel renderer to suppress report headers and use Excel headers instead:
The customer claimed that this configuration is so important that there is no way they could upgrade if this doesn’t work in SQL Server 2012. And after ensuring them that this is an easy fix, I’ve found myself spending hours to understand what needs to be done. On the positive side, I’ve picked up a few PowerShell skills along the way which may come handy given that PowerShell is omni-present nowadays.
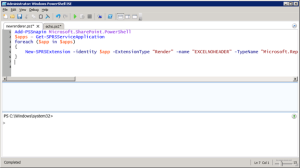
Solution: In SQL Server 2012 (SharePoint integrated mode), you need to make such changes with PowerShell. The PowerShell Cmdlets topic in BOL is a good writeup about the SSRS cmdlets. The following script gets the job done:
The script starts by importing the Microsoft.SharePoint.PowerShell snapi (you don’t need it if you run the remainder of the script in the SharePoint 2010 Management Shell). Then, the Get-SPRSServiceApplication cmdlet returns all the Reporting Services Service Applications available in the farm. For each application, I call the New-SPRSExtension to register the new renderer. To run the script:
Remote to the SharePoint server. You must have SharePoint Farm Administrator rights to run the script.
Open SharePoint 2010 Management Shell from the Microsoft SharePoint 2010 Products program group. Or, if you have installed the Windows PowerShell ISE feature, you can open Windows PowerShell ISE from the Accessories program group but make it sure to run it as administrator (right-click on it and click Run As Administrator).
Copy and paste the script, and hit Enter to run it. The figure below shows the script in Windows PowerShell ISE:
Do iisreset to apply the configuration changes.
For a full list of the New-SPRSExtension cmdlet parameters, you can execute the following command:
Get-help New-SPRSExtension – full
To verify that the changes are applied you could use one of the following two approaches:
Execute the following script to output the configuration of all extensions: $apps = Get-SPRSServiceApplication
2. In SSMS, connect to the SharePoint config database and run the following query. Examine the content of the Properties column to make sure that the custom extension is registered.
SELECT*FROM[dbo].[Objects] WHERE properties like‘%excelnoheader%’
I was tempted to try modifying directly the Properties column in the Objects table and add the new extension section but I realized I had better use of my time than troubleshooting failed SharePoint installations so I decided to stick with the supported way.
Special thanks to Prash Shirolkar from the Reporting Services team for shedding light in dark places. His blog has valuable insights about Reporting Services and SharePoint.
https://prologika.com/wp-content/uploads/2016/01/logo.png00Prologika - Teo Lachevhttps://prologika.com/wp-content/uploads/2016/01/logo.pngPrologika - Teo Lachev2011-11-16 01:19:002021-02-16 03:48:23Report Server Settings in SQL Server 2012 SharePoint Integration Mode
I ran into a couple of snags with the PowerPivot Management Dashboard and CTP3 of Denali. In this case, I’ve installed PowerPivot for SharePoint on a standalone domain controller.
The Actions web part of the PowerPivot Management Dashboard refuses to load with the following exception logged in the SharePoint URL log ” Unable to acquire information about the NT group ‘Enterprise Admins'” Resolution: This is a known issue that will be fixed in RTM. The workaround is to (1) delete any accounts that display their SIDs, i.e. they were part of a domain that is no longer valid, and (2) to delete any universal or enterprise groups Connect item: https://connect.microsoft.com/SQLServer/feedback/details/685945/system-exception-unable-to-acquire-information-about-the-nt-group-enterprise-admins
The dashboard doesn’t display any data although usage data is collected. This is caused by the fact that the PowerPivot system account doesn’t have rights to the PowerPivot SQL database and the timer job fails. The SQL Profiler shows the following error “The SELECT permission was denied on the object ‘vHealth’, database ‘DefaultPowerPivotServiceApplicationDB’, schema ‘Usage’. An error occurred while processing the ‘Health’ table.” Resolution: Grant the PowerPivot system account rights to all tables and views in the PowerPivot database Connect item: https://connect.microsoft.com/SQLServer/feedback/details/685955/no-data-in-powerpivot-management-dashboard-due-to-insufficient-rights
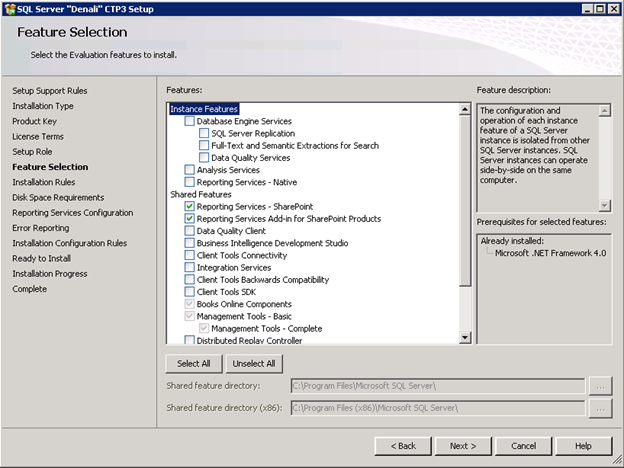
A week ago, I raved about how the new PowerPivot Configuration Tool would simplify configuring PowerPivot for SharePoint. Guess what? Setting up Reporting Services for SharePoint integrated mode got simplified too! In SQL Server Denali, Reporting Services leverages the SharePoint service application infrastructure and it doesn’t require installing a Reporting Services server. Not only this simplifies setup but improves performance because there is no round-tripping between SharePoint and report server anymore. Configuring Reporting Services for SharePoint integration mode is a simple process that requires the following steps:
Run the SQL Server Denali CTP3 setup and Install Reporting Services and the add-in on the SharePoint application server.
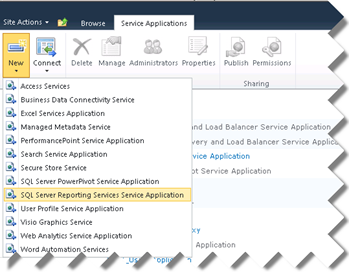
Once the bits are installed, open SharePoint Central Administration, and click Manage Service Applications. Expand the New button and click SQL Server Reporting Services Service application.
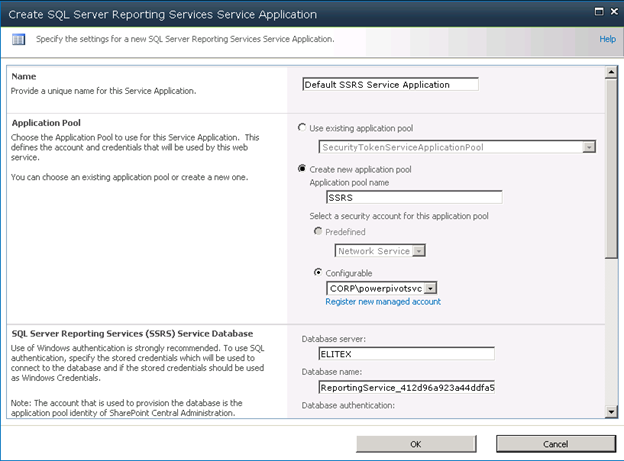
In the page that follows, configure the service application details as per your specific environment and click OK.
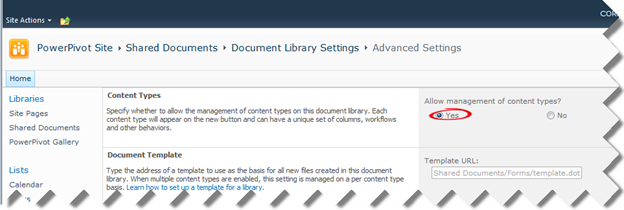
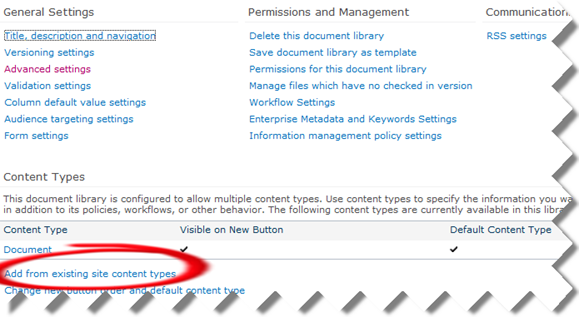
As with the previous releases, one more step is required to enable the SSRS content types in a given document library.
a) Go to the document library settings page and click Advanced Settings. In the Advanced Settings page, select Yes for the Allow management of content types?
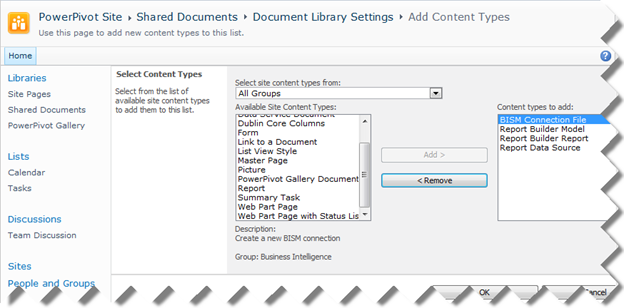
b) Back to the document library settings page, click the Add from Existing Site Content Types link. c) In the Add Content Types page, add BISM Connection File (assuming PowerPivot for SharePoint is configured), and the Report Builder content types.
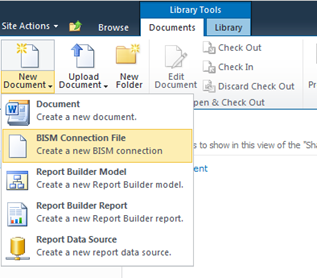
Voila! Once this is done, you can create Crescent reports. You just need to create a BISM Connection File that points to a PowerPivot model or BISM Tabular model.
https://prologika.com/wp-content/uploads/2016/01/logo.png00Prologika - Teo Lachevhttps://prologika.com/wp-content/uploads/2016/01/logo.pngPrologika - Teo Lachev2011-08-14 21:42:002016-02-16 10:52:26Reporting Services SharePoint Integration in SQL Server Denali
One great enhancement in SQL Server 11 (Denali) is the PowerPivot for SharePoint setup refactoring. Previously, the PowerPivot for SharePoint setup and configuration was included and performed at the end of the SQL Server setup. Consequently, it was very difficult to figure out what went wrong. In Denali, you need to perform the PowerPivot for SharePoint configuration as a post-installation step after the SQL Server setup completes. You can do this using the new PowerPivot Configuration Tool, SharePoint Central Administration, or PowerShell.
You can find the PowerPivot Configuration Tool in the SQL Server Denali CTP3 ð Configuration Tools program group. When you open the tool, it examines the SharePoint setup and presents a list of tasks (if any) that need to be done to configure PowerPivot for SharePoint so it’s operational. Once you validate the tasks and run them, the tool would perform the steps one at a time and indicate which step is currently taking place. You can select task and click the Script tab to see a PowerShell script for that task or the Output tab to see an execution log.
If a step fails, the tool stops and the rest of the steps are not executed. You need to examine what went wrong, fix it, and rerun the tool to execute the remaining tasks. You can also use the tool to remove features, services, applications. and solutions.
SharePoint is great product but it’s also very complex and difficult to troubleshoot. The PowerPivot Configuration Tool will simplify the management effort to configure PowerPivot for SharePoint.
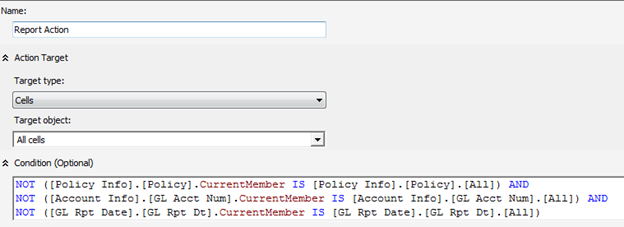
Report actions are an Analysis Services extensibility mechanism that lets end users run a Reporting Services report as they browse the cube. A customer reported that they have trouble setting up a Reporting Services action for a report server configured in a SharePoint integrated mode – a scenario which appears that wasn’t tested properly by Microsoft.
First, the customer wanted to pass multiple parameters to the report. This was achieved by setting up the report action Target Type to Cells and Target Object to All Cells. This setup allows the user to right-click any cell on the cube to initiate the action. What’s more important is that an action-capable browser, such an Excel, will be able to collect the coordinates of all dimensions used in the browser, such as those added to the filter area, so you can pass them as parameters to the report.
A condition is further specified to restrict the action. Because the cube browser will be passing three parameters to the report, the condition enables the action only if the corresponding members’ current member is not the All member.
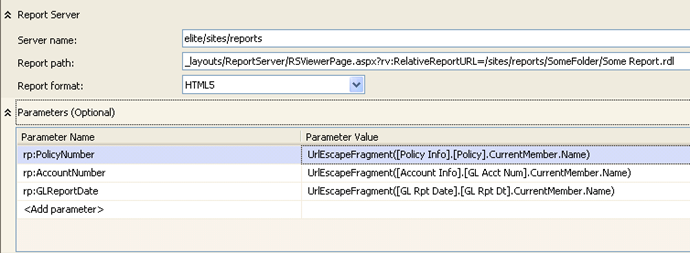
This is where things get interesting. You need to specify the server name and report path. Instead of pointing to the report server, you should point to the SharePoint library using the syntax that Prash Shirolkar from the Reporting Services explains in his blog. I haven’t tested this but I’d expect that if you reference the report server, the report will use the report definition copy on the report server and not the one stored in SharePoint. Recall that the latter is the master copy of the report definition and the one in the report server might be outdated. However, when you reference the SharePoint library, you’ll find that Analysis Services doesn’t prefix the parameters with rp:, which in turn makes the report server ignores the parameters. The ultimate hack is to prefix the parameters yourself:
Here, the server name is set to the SharePoint site URL. I’ve found that actually it doesn’t matter where you break the URL to server name and report path. SSAS will concatenate them, so I could have set the server name to elite only and moved the rest of the URL to the Report Path line. Also, notice that you don’t use http: as in http://elite/sites/reports. SSAS will add the protocol for you.
https://prologika.com/wp-content/uploads/2016/01/logo.png00Prologika - Teo Lachevhttps://prologika.com/wp-content/uploads/2016/01/logo.pngPrologika - Teo Lachev2010-12-12 02:39:002021-02-16 03:47:49Report Actions for Report Server in SharePoint Mode
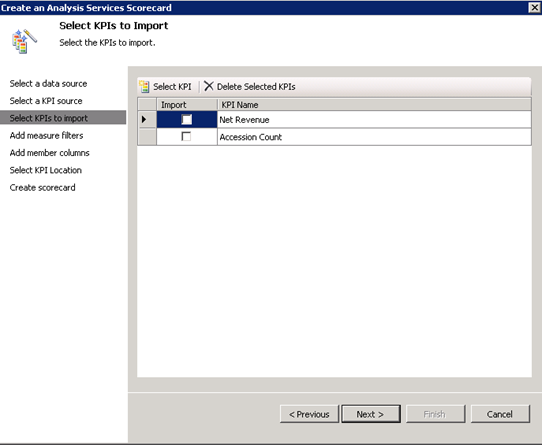
Forging ahead through the unchartered land of PerformancePoint 2010, I ran into a snag today. Attempting to import Analysis Services KPIs resulting in the following error:
An unexpected error occurred. Error 47205.
Exception details:
System.IO.FileNotFoundException: Could not load file or assembly ‘Microsoft.AnalysisServices, Version=10.0.0.0, Culture=neutral, PublicKeyToken=89845dcd8080cc91’ or one of its dependencies. The system cannot find the file specified.
at Microsoft.PerformancePoint.Scorecards.Server.ImportExportHelper.GetImportableAsKpis(DataSource asDataSource)
at Microsoft.PerformancePoint.Scorecards.Server.PmServer.GetImportableAsKpis(DataSource dataSource)
Since in our case, PerformancePoint was running on a SharePoint web front end server (WFE) which didn’t have any of the SQL Server 2008 components installed, it was clear that PerformancePoint was missing a connectivity component. Among many other things, I tried installing the Analysis Services Management Objects (AMO) from the SQL Server 2008 Feature Pack but the error won’t go away. I fixed it by running the SQL Server 2008 setup program and installing the Client Tools Connectivity option only. Then, the KPIs magically appear in the Scorecard Wizard.
PerformancePoint? Is it still around? It is (in SharePoint 2010), and it should peak your interest if you are serious about dashboarding. The planning component is of course gone and I have to admit I never had too much faith in it. When comes to dashboards, Microsoft gives you two implementation options:
Reporting services reports in SharePoint web parts – Pros include low cost because Reporting Services is available with SharePoint Foundation, and no need to learn new skills. On the downside, you need to implement your own global filter web parts assuming that you don’t use SharePoint Server.
PerformancePoint – This is tool specifically designed for dashboards and it just got better in SharePoint 2010. However, it requires SharePoint Server 2010 which you need for PowerPivot as well. Unfortunately, this puts you in the $5,000+ upfront investment bucket (Vidas has more to say about SharePoint pricing).
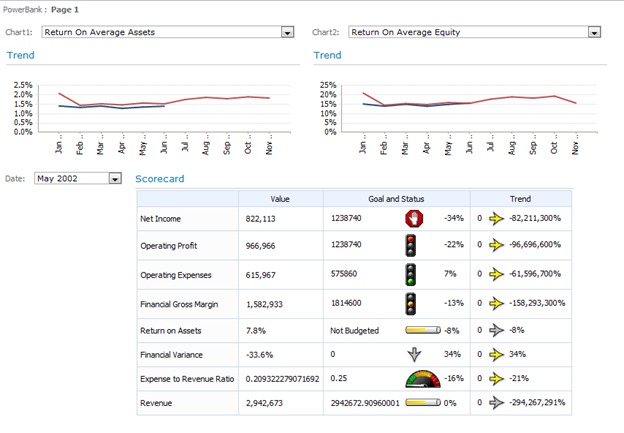
Personally, I was pleasantly surprised when I re-discovered PerformancePoint in SharePoint 2010. Here is a cool little dashboard I put together in a couple of hours after importing the Adventure Works KPIs.
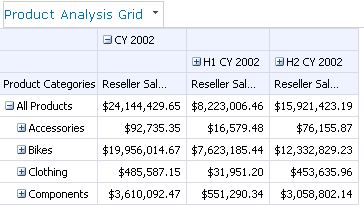
I’ve been complaining for a while that Microsoft doesn’t have a web-based OLAP browser. PerformancePoint reporting capabilities (chart and grid) come pretty close. Below is a grid report bound to the Adventure Works reseller data. It would be really cool if PerformancePoint continues the trend to fill in the gap and adds more Excel-like features, such as filters, slicers, etc.
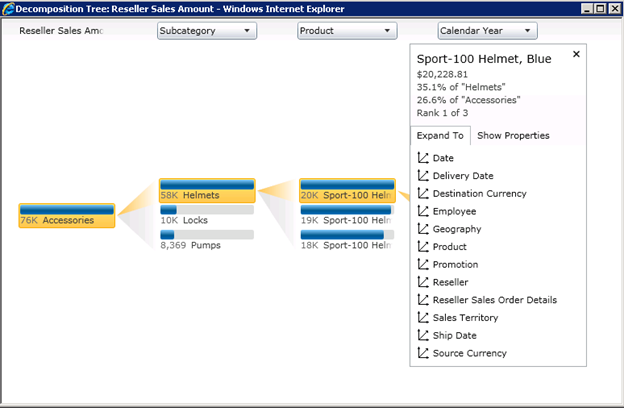
Yes, we now have the ProClarity remnants in the form of a Silverlight-based decomposition tree (requires Silverlight 3.0 on the client). To get it, I right-clicked a cell on the report and clicked Decomposition Tree. This lets me analyze sales by any dimension.
So, what’s the catch except the cost? The ridiculously difficult Kerberos configuration of course if you have a multi-server environment. In our case, just when we thought we conquered the Kerberos beast with SSRS, we’ve found the PerformancePoint doesn’t work. As it turned out, unlike Reporting Services, PerformancePoint requires a constrained delegation and uses the Claims for Token service. So, follow the steps in the Configuring Kerberos Authentication for SSRS 2008 R2 with SharePoint 2010 whitepaper closely.
If you have SharePoint 2010 Server already, PerformancePoint definitely warrants your interest.
Every now and then, I run into mysterious report timeouts. This time the client had a farm of two report servers integrated with MOSS with long running reports that would time out after two minutes or so. Normally, you shouldn’t have such report monsters but life is not perfect, right? The client did a due diligence and had checked/changed every possible timeout setting, including:
Report Processing Timeout in the Reporting Services Server Defaults settings in SharePoint Central Administration.
The httpRuntime settings on all SharePoint farm servers’ web.config files:
The “databaseQueryTimeout” value in the RSReportServer.config file from 120 to 900 (15 minutes).
<Add Key=”DatabaseQueryTimeout” Value=”900″/>
The connection timeout in IIS for the web site on each MOSS server from 120 to 240 seconds.
Alas, no help. Reports would still time out. After much investigation, we discovered a server timeout setting on the load balancer which was set for 2 minutes. After increased it to 15 minutes, the problem went away. So many timeout settings, so little time…
Want more timeout tips? Check out this blog which I wrote four years ago.
 Well, rules have changed. As Jaime Tarquino from the SSRS team explained in his blog, “SQL Server 2012 Reporting Services SharePoint Integrated Mode”, there is no rsreportserver.config file anymore moving to Reporting Services 2012 in SharePoint integration mode (there are no configuration changes with native mode). Instead, the configurations sections are now saved in the SharePoint configuration database.